Operation using the touchscreen
Solar-Log
1000
User Manual
39 of 131
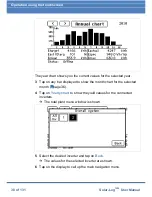
3.2.6 Total chart
1
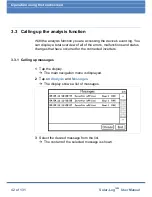
Tap the display with your finger.
The main navigation menu is displayed.
2
Tap on
Chart
and tap on
Total
.
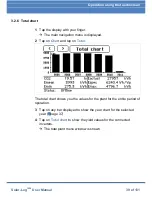
The total chart shows you the values for the plant for the entire period of
operation.
3
Tap on any bar displayed to show the year chart for the selected
year (
page 37).
4
Tap on
Total chart
to show the yield values for the connected
inverters.
The total plant menu window is shown.
Summary of Contents for Solar-Log 1000
Page 1: ......


