
93
Chapter 4: Graphing Features
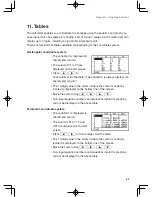
11. Tables
The calculator enables you to illustrate the changes using the equation and graph you
have input. It also has tables for showing a list of X and Y values. Each column item can
display up to 7 digits, including a sign and/or a decimal point.
There are four kinds of tables available corresponding to the coordinate system.
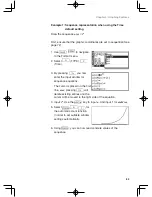
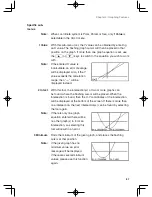
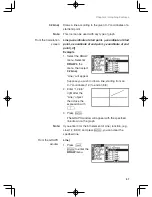
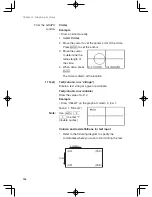
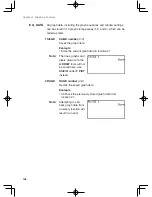
Rectangular coordinate system
• The variable X is displayed in
the left end column.
• The columns Y1 to Y3 are
displayed on the first screen.
• Press
;
'
to
horizontally scroll the table. (The variable X is always displayed in
the left end column.)
• The 10-digit value in the column where the cursor is currently
located is displayed on the bottom line of the screen.
• Move the cursor using
;
'
{
}
.
• Non-input equation numbers and equations invalid for graphing
will not be displayed in the above table.
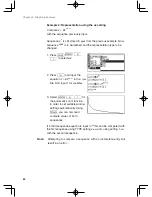
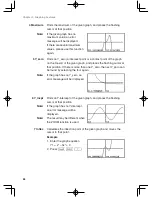
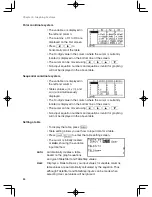
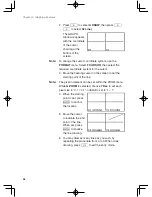
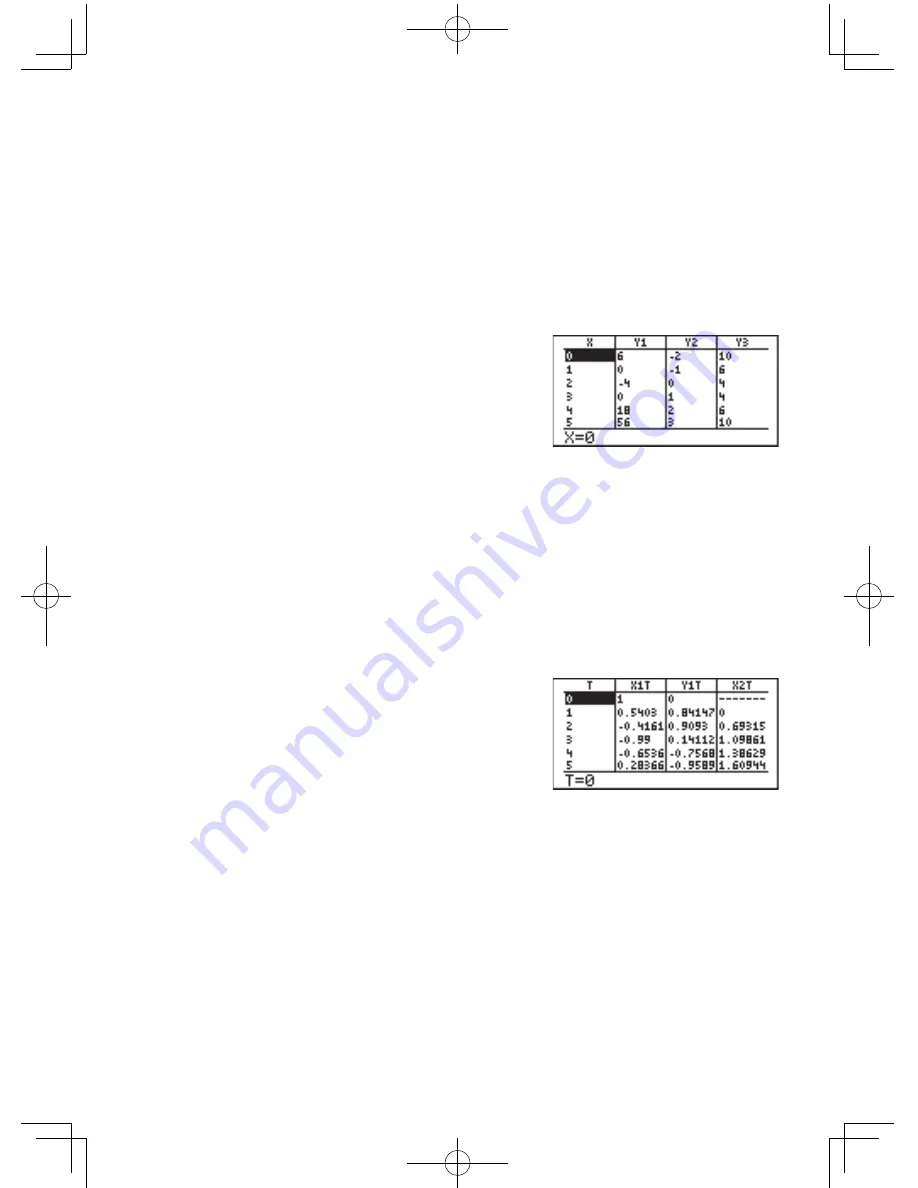
Parametric coordinate system
• The variable T is displayed in
the left end column.
• The columns X1T, Y1T, and
X2T are displayed on the first
screen.
• Press
;
'
to horizontally scroll the table.
• The 10-digit value in the column where the cursor is currently
located is displayed on the bottom line of the screen.
• Move the cursor using
;
'
{
}
.
• Non-input equation numbers and equations invalid for graphing
will not be displayed in the above table.