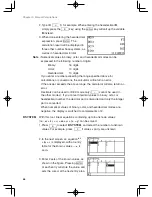
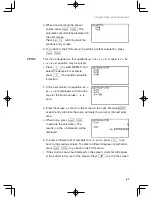


68
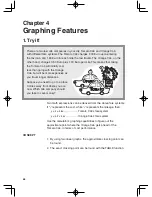
Chapter 4
Graphing Features
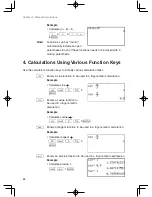
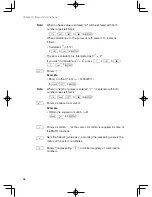
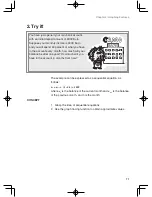
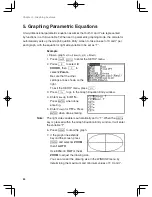
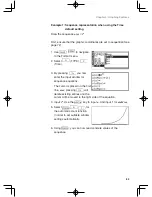
1. Try it!
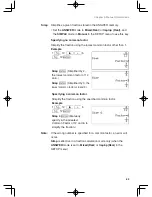
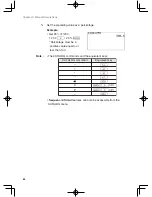
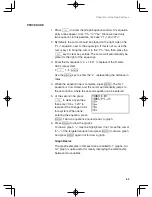
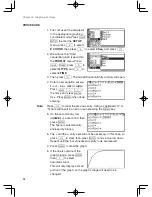
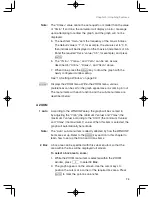
Two math expressions can be derived from the above fare systems.
If “
y
” represents the cost, while “
x
” represents the mileage, then:
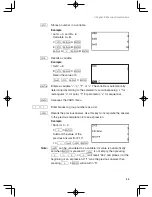
y = 2 + 1.8x
................... Tomato Cab’s fare system
y = 3.5 + 1.2x
................ Orange Cab’s fare system
Use the calculator’s graphing capabilities to figure out the
approximate point where the Orange Cab gets ahead of the
Tomato Cab, in terms of cost performance.
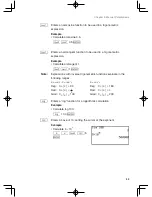
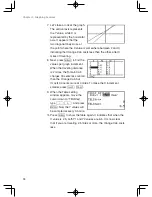
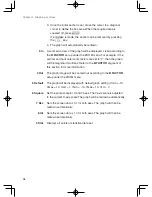
CONCEPT
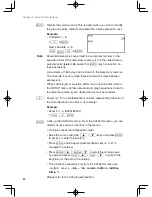
1. By using two linear graphs, the approximate crossing point can
be found.
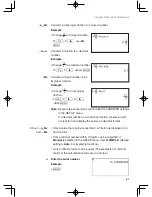
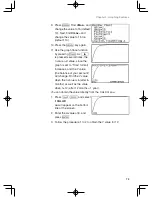
2. The exact crossing point can be found with the TABLE function.
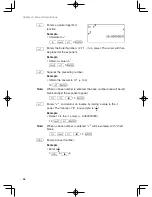
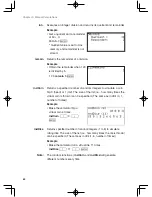
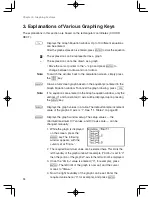
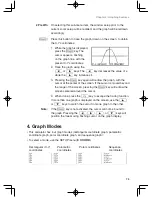
There are two taxi cab companies in your city, Tomato Cab and Orange Cab,
with different fare systems. The Tomato Cab charges 2.00 Euro upon entering
the taxi cab, and 1.80 Euro for each mile the taxi travels. The Orange Cab, on the
other hand, charges 3.50 Euro plus 1.20 Euro per mile. This means that taking
the Tomato Cab will initially cost
less than going with the Orange
Cab, but will be more expensive as
you travel longer distances.
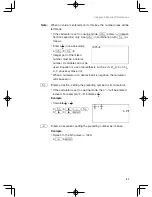
Suppose you need to go to a place
3 miles away from where you are
now. Which cab company should
you take to save money?


