
160
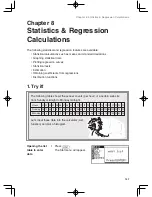
Chapter 8: Statistics & Regression Calculations
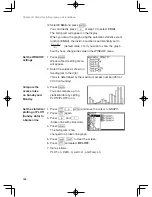
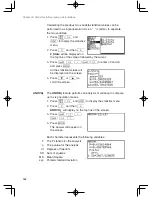
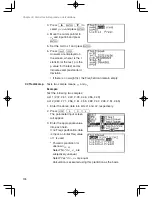
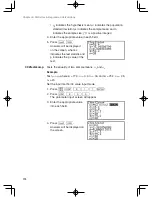
3. • To set the all plotting ON: Press
1
(
1 PlotON).
• To set the all plotting OFF: Press
2
(
2 PlotOFF).
* You can control the plotting of
PLOT1 to PLOT3 separately by
pressing
1
~
3
after
PlotON (or PlotOFF).
4. Press
E
to set.
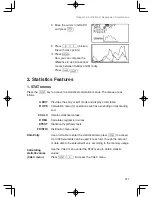
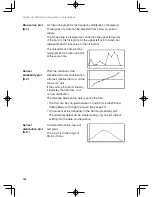
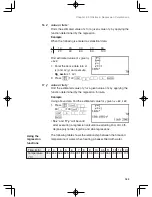
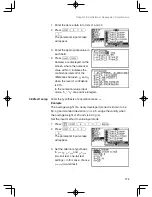
4. Trace function of statistical graphs
• The trace feature is available in statistical graphing and can be used to trace the
curves of graphs with the cursor.
1. Press
U
.
2. Use
;
or
'
to move the cursor pointer to trace the
graph curve.
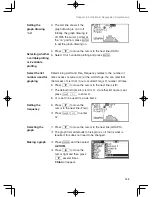
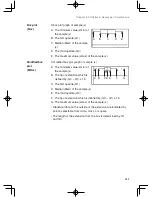
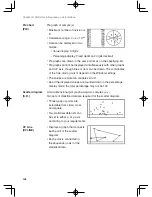
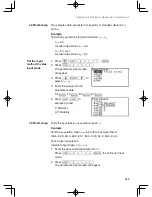
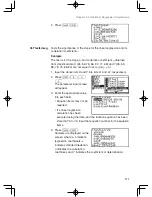
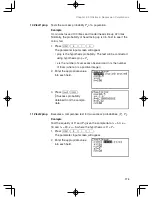
How tracing is done
• After pressing
U
, the
cursor pointer will appear on
the top left corner of the first
bar.
• If you press
;
or
'
, the cursor pointer sequentially
jumps between top left corners of the bars.
• X and Y values are displayed at the bottom line of the screen.
• Use
{
or
}
to change between graphs to trace.
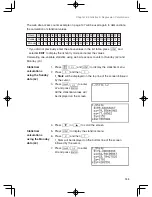
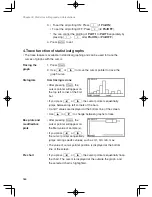
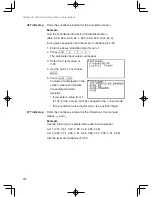
• After pressing
U
, the
cursor pointer will appear on
the Med value of sample (x).
• If you press
;
or
'
,
the cursor pointer sequentially
jumps among specific values, such as Q1, Q3, min, max.
• The value of cursor pointer position is displayed at the bottom
line of the screen.
• If you press
;
or
'
, the cursor pointer sequentially trace
the chart. The cursor is displayed at the outside the graph, and
the selected chart is highlighted.
Tracing the
graph
Box plots and
modified box
plots
Histogram
Pie chart


