
102
Chapter 4: Graphing Features
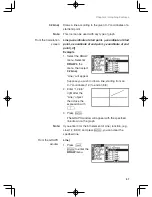
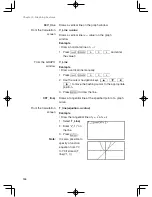
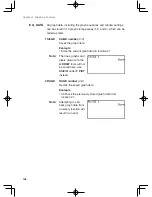
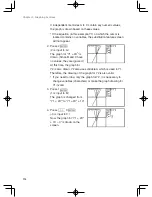
N_line(
Example
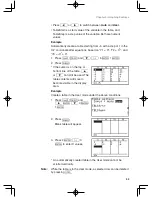
• Draw a normal line by manually specifying the point.
1. Select
N_Line(.
2. Use
;
'
to move the flashing cursor on the
targeted graph line.
Use
{
}
to select a graph to draw the
orthogonal line.
3. When the point is set at the point, press
E
.
• It is also possible to input the x-value and press
E
.
Note: The equation of the line is displayed temporally. (The
equation may include a margin of error.)
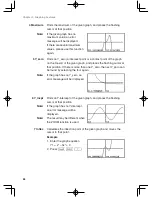
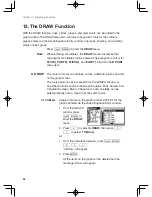
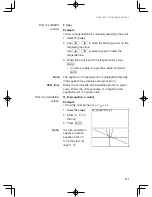
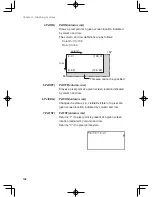
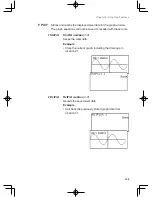
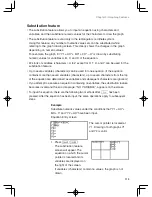
07 Draw
Draw
equation
Draws an additional graph based on a given expression.
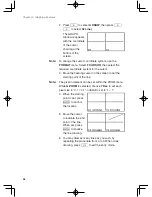
Example
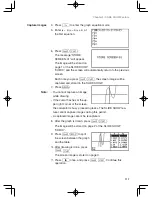
• Draw the graph of
y = 3x
2
-4x+2
.
1. Select
Draw.
2. Enter “3x
2
–
4x
+
2”
on the line.
3. Press
E
.
Note: This tool can be used with rectangular coordinate
graphs only.
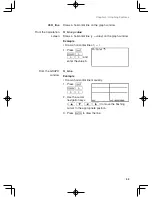
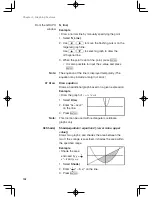
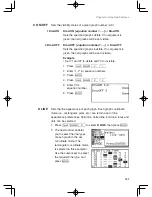
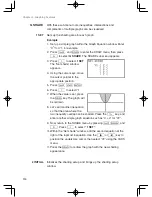
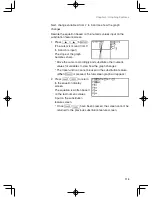
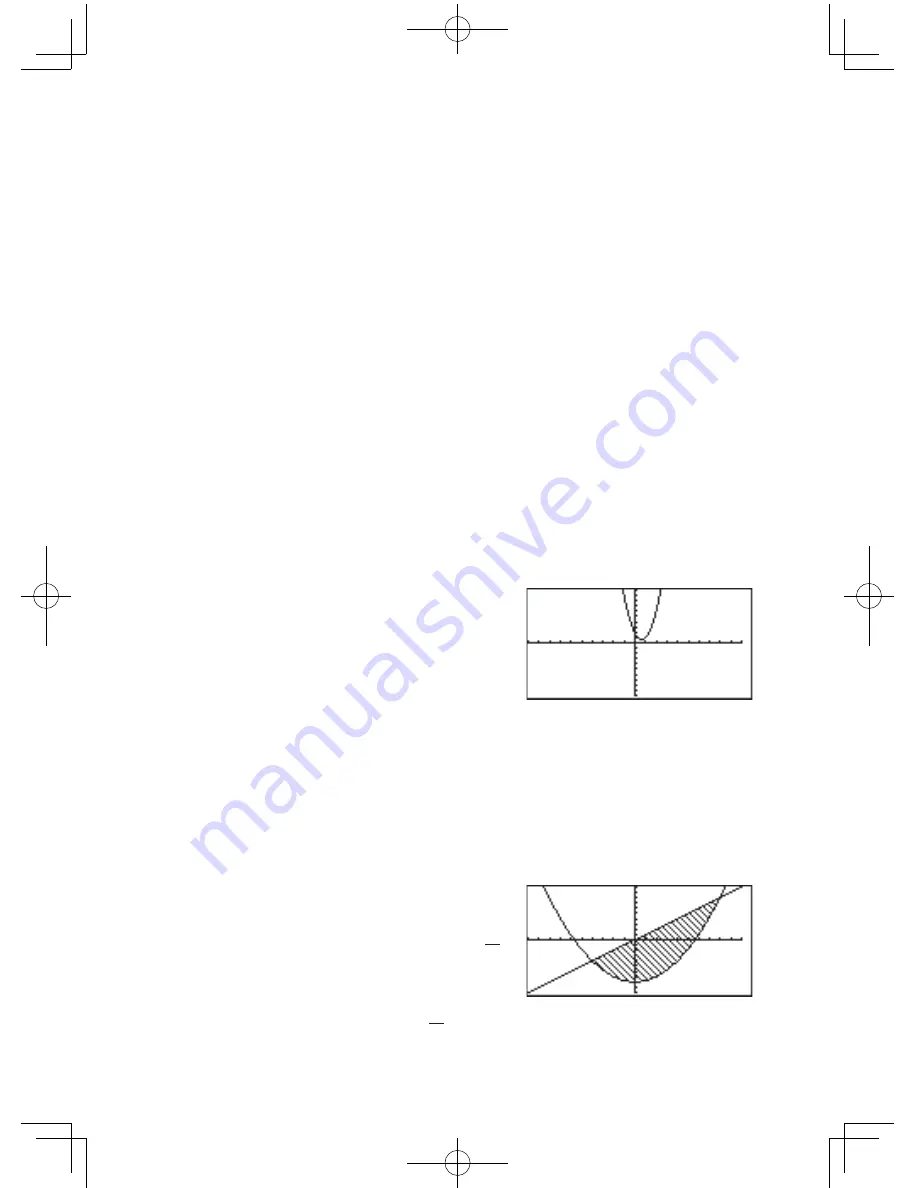
08 Shade(
Shade(
equation1, equation2 [, lower value, upper
value]
)
Draws two graphs, and shades the area between the
two. If the x range is specified, it shades the area within
the specified range.
Example
• Shade the area
enclosed by
y =
1
4
x
2
– 8
and
y = x
.
1. Select
Shade(.
2. Enter “
1
4
x
2
–
8, x)” on the line.
3. Press
E
.
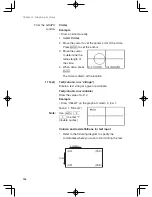
From the GRAPH
window


