154
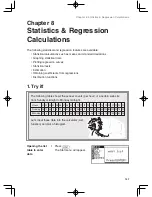
Chapter 8: Statistics & Regression Calculations
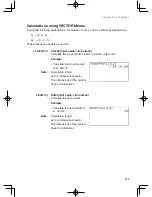
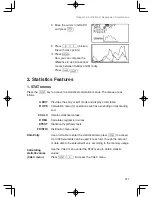
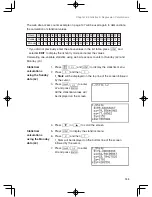
Calculating the previous two-variable statistical values can be
performed in a single operation. Use a “ , ” (comma) to separate
the two variables.
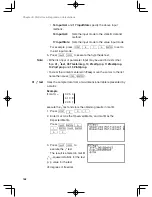
1. Press
#
C
and
S
to display the statistics
menu.
2. Press
C
and then
2
.
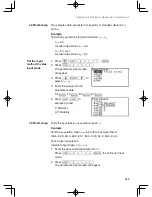
2_Stats will be displayed on
the top line of the screen followed by the cursor.
3. Press
@
2
,
@
3
to enter L2 and L3,
and press
E
.
All the statistical values will
be displayed on the screen.
4. Press
}
or
{
to
scroll the screen.
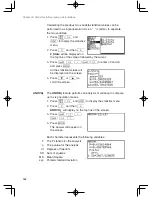
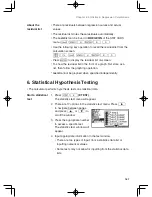
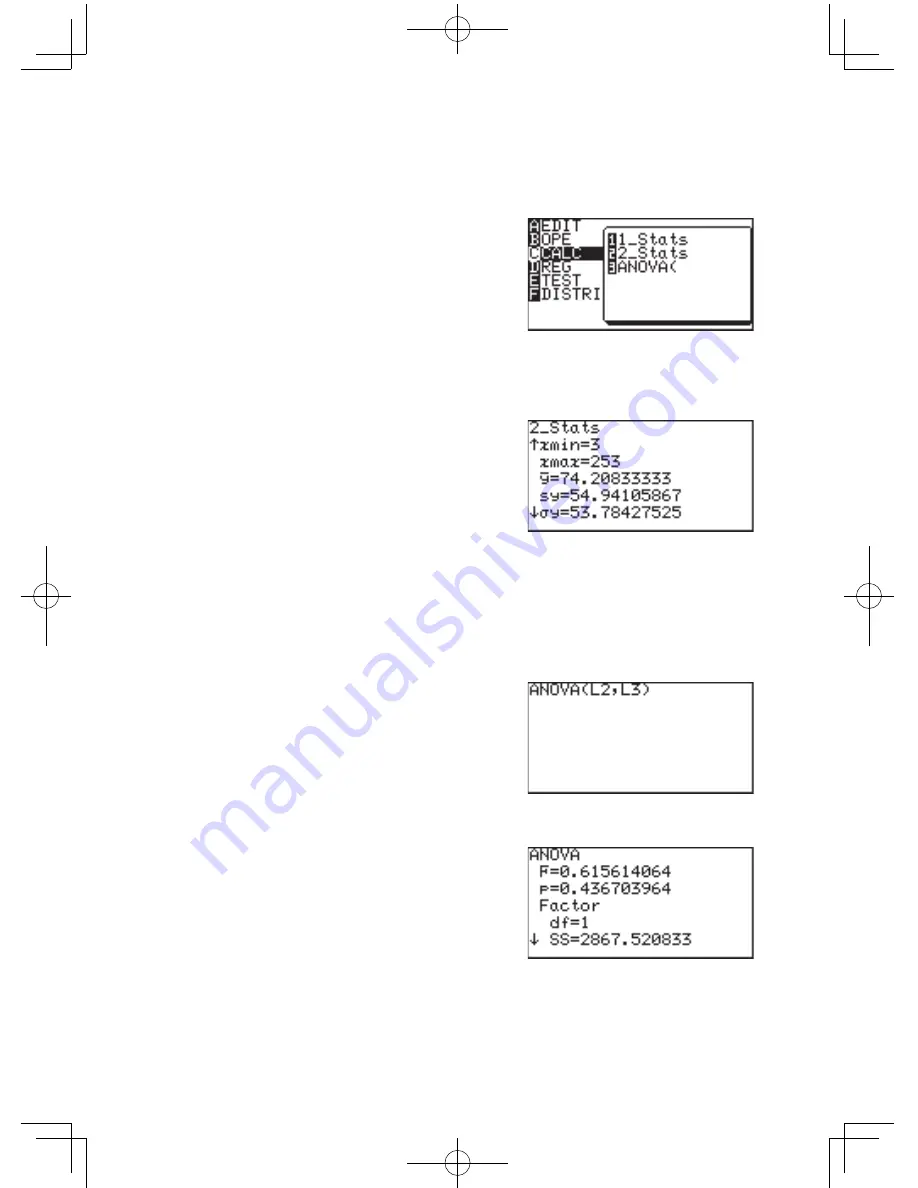
ANOVA( The
ANOVA( feature performs an analysis of variance to compare
up to six population means.
1. Press
#
C
and
S
to display the statistics menu.
2. Press
C
and then
3
.
ANOVA(_ will display on the top line of the screen.
3. Press
@
2
,
@
3
)
.
4. Press
E
.
The answer will appear on
the screen.
Each character represents the following variables.
F The F statistic for the analysis
p The p value for the analysis
df Degrees of freedom
SS Sum of squares
MS Mean Square
sxp Pooled standard deviation


