

200
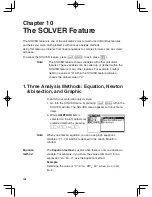
Chapter 10: The SOLVER Feature
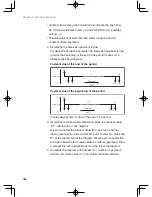
The
Graphic method is another way of approximating solutions,
using graphical representations. This method is particularly useful
when finding more than one solution on a graph axis.
Example
Obtain values for “Y = X
3
–
3X
2
+
1”, when Y = 0.
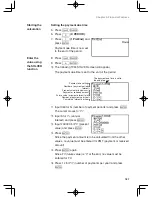
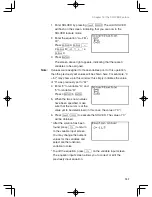
1. Press
@
'
to enter SOLVER. Clear screen entries by
pressing
C
several times.
2. Enter “Y = X
3
–
3X
2
+
1” into
the initial window, and press
E
.
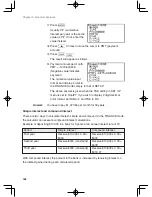
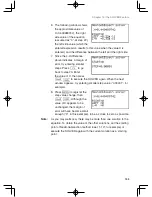
3. In the next window, set the Y
value as “0”, and press
E
.
The right side value of the
equation is now set.
Note: Unlike in the Newton&bisection
method, the X value will not be
assumed as the starting point for
the Graphic method.
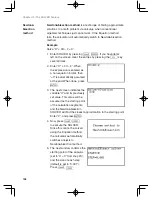
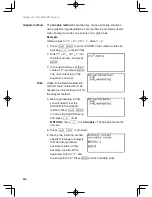
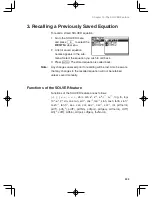
4. Before proceeding further,
you will need to set the
SOLVER to the Graphic
method. Press
@
'
to call up the SOLVER menu,
and press
A
(for
A
METHOD), then
3
(for
3 Graphic). The Graphic method is
now set.
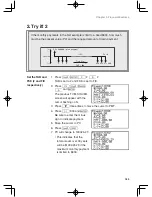
5. Press
@
h
to proceed.
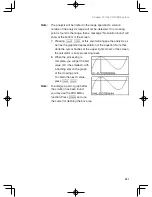
6. Next in the following window,
specify the range of analysis
that will incorporate all
possible solution. In this
example, we will set the
beginning point at “
-
1”, and
the end point at “3”. Press
E
at each variable entry.
Graphic method


