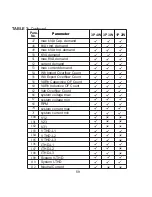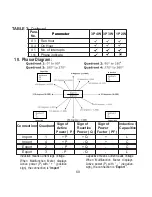
8. Power Quality Measurement:
The instrument measures the three power quality events, namely voltage sag, voltage swell and
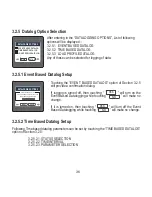
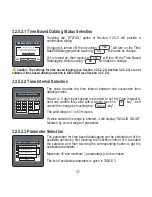
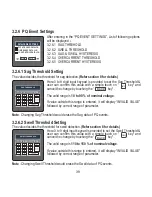
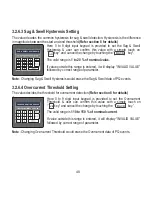
overcurrent.
These events get stored in tabular form giving the corresponding date & time of event start and
its duration. The minimum event duration that can be recorded is 100mseconds.
Maximum of 30 such events get stored in the table one by one in the first in first out manner i.e.,
the 31st event replaces 1st event and so on.
Touching a particular event in the table gives the detailed information about the corresponding
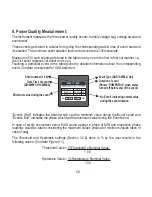
event. Consider an example for SAG detection:
LINE-NEUTRAL VOLTAGE
LINE-NEUTRAL VOLTAGE
LINE-NEUTRAL VOLTAGE
CT SECONDARY
LINE-NEUTRAL VOLTAGE
LINE-NEUTRAL VOLTAGE
LINE-NEUTRAL VOLTAGE
EVENT 11 : SAG
MAIN
BACK
MIN AT L1
MIN AT L2
MIN AT L3
Event’s Start
Event’s End
188.9
No Event
187.2
V
V
V
Started at 12/08/2018,14:23:54 for 0.100 seconds
Date, Time of event
(DD/MM/YY, HH:MM:SS)
Duration of event
(Shows “POWERFAIL” when meter
turned off before end of the event)
Event Type (SAG/ SWELL/ OvI)
Minimum value during the event
“No Event” indicating normal value
during the event duration
Event number (1-30)
“Ëvent’s Start” indicates the phase which had the minimum value during the Event’s start and
“Ëvent’s End” indicates the phase which had the minimum value during the Event’s end.
In case of swell/ overcurrent event, MAX would appear in place of MIN and respective phase
readings would be taken considering the maximum values (instead of minimum values taken in
case of sag).
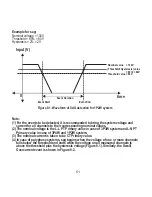
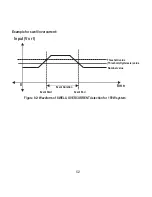
The Threshold and Hysteresis settings (Section 3.2.6) done in % by the user results in the
following values: (Consider Figure 9.1)
Threshold Value = (%Threshold) x Nominal Value
1 0 0
Hysteresis Value = (%Hysteresis) x Nominal V alue
1 0 0
50
Summary of Contents for Master 3440iDL 0.2SS
Page 2: ......

