background image

RIGOL


Front Panel Key Reference


2-102 

User’s Guide for DSA1000 Series 

2.6.2.7


  Brightness   

Sets the LCD brightness of the analyzer.   
You can modify this parameter using the numeric keys, knob or direction keys. For 
more details, please refer to Parameter Input.   
 
Table 2-64 Brightness setting 

Parameter 

Explanation 

Range 

0 to 7 

Unit 

N/A 

Knob Step 

Direction Key Step  


2.6.2.8


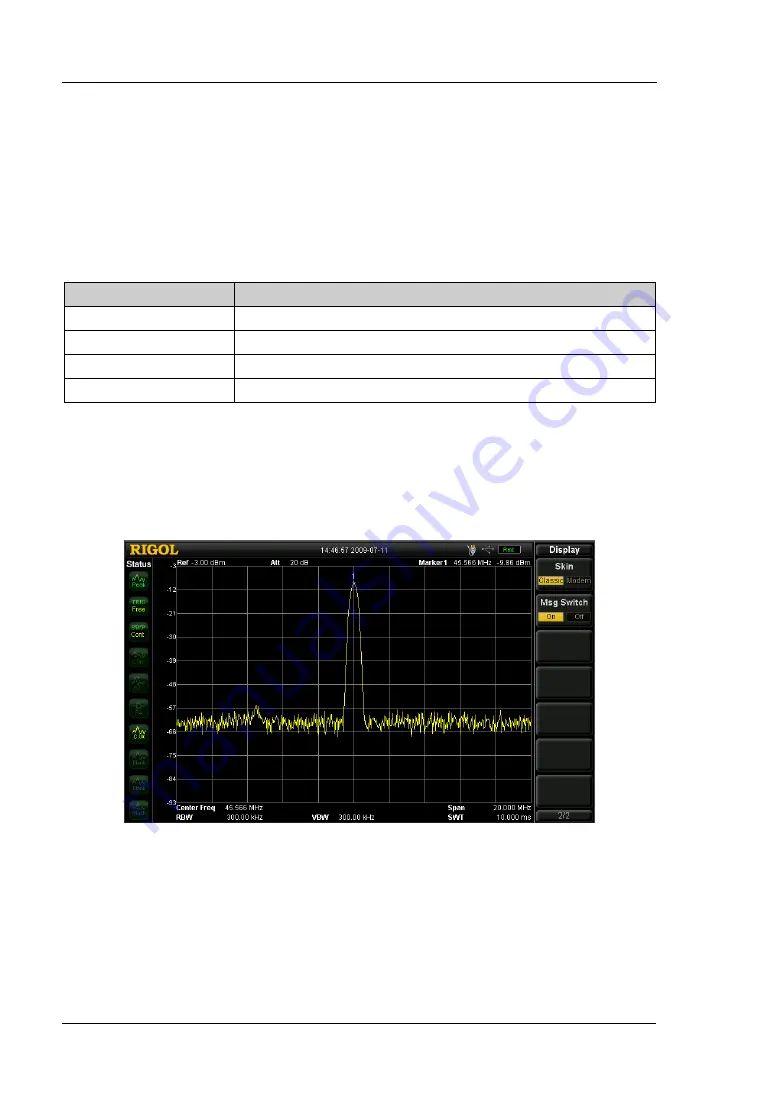
  Skin   

Sets the skin to Classic or Modern. 


Figure 2-30 Classic display 


Summary of Contents for DSA1030

Page 1: ...RIGOL User s Guide DSA1000 Series Spectrum Analyzer Sept 2014 RIGOL Technologies Inc...

Page 2: ......

Page 3: ...on in this publication replaces all previously corresponding material Information in this publication is subject to change without notice RIGOL shall not be liable for losses caused by either incident...

Page 4: ...he Protective Earth terminal before any inputs or outputs Connect the Probe Correctly If a probe is used do not connect the ground lead to high voltage since it has isobaric electric potential as the...

Page 5: ...e in an Explosive Atmosphere In order to avoid damages to the device or personal injuries it is important to operate the device away from an explosive atmosphere Keep Product Surfaces Clean and Dry To...

Page 6: ...nce level and maximum span frequency should be selected so as to make the signals displayed within the screen Know About the Specification Conditions of the Instrument For maximum performance of the i...

Page 7: ...ces that could result in damage to this product or other property Terms Used on the Product These terms may appear on the product DANGER indicates an injury or hazard may immediately happen WARNING in...

Page 8: ...ments geerdet Schlie enSie die Erdungsklemmen an keine hohe Spannung an Beachten Sie alle Anschl sse Zur Vermeidung von Feuer oder Stromschlag beachten Sie alle Bemerkungen und Markierungen auf dem In...

Page 9: ...Vermeidung von Personen und Sachsch den ist es unumg nglich das Ger t ausschlie lich fernab jedweder explosiven Atmosph re zu betreiben Ger teoberfl chen sauber und trocken halten Um den Einflu von S...

Page 10: ...quellen die Sch den am Ger t hervorrufen k nnen Begriffe auf dem Produkt Diese Bedingungen k nnen auf dem Produkt erscheinen DANGER weist auf eine Verletzung oder Gef hrdung hin die sofort geschehen k...

Page 11: ...industrial production and many other fields Main features Frequency Range 9 kHz to 3 GHz Display Average Noise Level DANL 138 dBm Phase Noise 80 dBc Hz 10 kHz offset Typical Total Amplitude Accuracy 1...

Page 12: ...pter lists the troubleshooting information and messages that may appear during the use of the analyzer 6 Specification This chapter lists the general specifications of the analyzer 7 Menu Map This cha...

Page 13: ...n 1 13 1 3 2 Disassemble the Front Panel Cover 1 14 1 3 3 Adjust the Supporting Legs 1 14 1 3 4 Connect the Power 1 15 1 3 5 Power On Check 1 17 1 3 6 Self Calibration 1 17 1 3 7 Use the Lock 1 17 1 3...

Page 14: ...2 48 2 4 2 Meas Setup 2 51 2 5 Marker Measurements 2 76 2 5 1 Marker 2 76 2 5 2 Marker 2 82 2 5 3 Marker Fctn 2 84 2 5 4 Peak 2 87 2 5 5 L Peak 2 91 2 5 6 R Peak 2 91 2 6 System Functions 2 92 2 6 1...

Page 15: ...nt 3 32 3 15 Amplitude Correction 3 34 3 16 Tracking Generator For DSA1030 TG 3 36 4 Remote Control 4 1 4 1 Remote Control Via USB 4 2 4 2 Remote Control Via LAN 4 4 4 3 Remote Control Via GPIB 4 7 5...

Page 16: ...OBW 7 14 7 11 5 EBW 7 14 7 11 6 C N Ratio 7 15 7 11 7 Harmonics Dist 7 15 7 11 8 TOI 7 16 7 11 9 Pass Fail 7 16 7 12 Peak 7 17 7 13 Print Setup 7 18 7 14 SPAN 7 19 7 15 Storage 7 20 7 16 Sweep 7 21 7...

Page 17: ...4 Disassemble the front panel cover 1 14 Figure 1 15 Adjust the supporting legs 1 14 Figure 1 16 Power cord connection 1 15 Figure 1 17 Install the Battery 1 16 Figure 1 18 Use the lock 1 17 Figure 1...

Page 18: ...igure 2 27 Frequency Count measurement 2 86 Figure 2 28 Peak Table 2 90 Figure 2 29 LAN parameter setting 2 94 Figure 2 30 Classic display 2 102 Figure 2 31 Modern display 2 103 Figure 2 32 File opera...

Page 19: ...17 Amplitude correction 3 35 Figure 3 18 The frequency response of a filter 3 37 Figure 4 1 View the resource 4 2 Figure 4 2 Write and read commands via USB 4 3 Figure 4 3 Search LAN resources 4 4 Fi...

Page 20: ...ble 2 12 RBW 2 21 Table 2 13 VBW 2 22 Table 2 14 V R Ratio 2 22 Table 2 15 Sweep time 2 24 Table 2 16 Numbers 2 25 Table 2 17 Points 2 26 Table 2 18 Trigger level 2 30 Table 2 19 Average times 2 38 Ta...

Page 21: ...nt 2 67 Table 2 46 The Offset Freq of C N Ratio measurement 2 67 Table 2 47 Noise BW of C N Ratio measurement 2 68 Table 2 48 The Carrier BW of C N Ratio measurement 2 68 Table 2 49 Average number for...

Page 22: ......

Page 23: ...el and the user interface as well as announcements during first use of the analyzer and shows the usage through a measurement example demo Subjects in this chapter Front Panel Rear Panel Prepare for U...

Page 24: ...Description NO Description NO Description LCD Full screen Menu key Zoom window page up Switch window Numeric keyboard One button help Function key area Back Knob Page down Down Tracking generator outp...

Page 25: ...ll as the signal tracking function Sets the frequency sweep span Sets the reference level RF attenuator scale and the unit of Y axis etc Sets the Resolution Bandwidth and Video Bandwidth of the analyz...

Page 26: ...he demodulation Sets the tracking generator Advanced measure Select a desired advanced measurement function Sets the parameters for the selected measurement function Marker measure Reads the amplitude...

Page 27: ...rs Sets the display parameters Executes the selected preset function resets the system into specified status modifies all sweep parameters measure settings as well as system parameters for following m...

Page 28: ...p mode is Single or Continue respectively 3 Meas The backlight of Meas will be automatically turned on once any measurements are activate and stay on until all measurement functions are disabled 4 Sou...

Page 29: ...DSA1000 Series 1 7 Green battery electricity 80 Orange 20 battery electricity 80 Red battery electricity 20 Off the battery is not installed or the battery contains no electricity Note For DSA1030 TG...

Page 30: ...interface is available for USB storage devices and the USB GPIB module See the following connections USB storage device connection GPIB extended connection Figure 1 4 USB Host interface connections 2...

Page 31: ...nerator 3 PROBE POWER This connector provides two lines of power supply to a RF probe 15 V 150 mA and 12 6 V 150 mA 4 RF INPUT 50 The RF input may be connected to a device under measure via an N male...

Page 32: ...120 V 45 Hz 440 Hz AC 200 V 240 V 45 Hz 65 Hz 2 Rechargeable battery China Only An optional power source of 10 V 18 V a fully charged battery can provide 3 hours of continuous operation 3 TRIGGER IN...

Page 33: ...ER IN connection 4 10MHz IN OUT The BNC input or output of the 10 MHz reference clock see figure below Figure 1 9 10 MHz IN OUT connection 5 VGA port This port provides a VGA signal output which is us...

Page 34: ...te control connection Figure 1 11 PictBridge printer connection Figure 1 12 USB remote control connection 7 LAN interface Through this interface the analyzer can be connected to your local network for...

Page 35: ...l and mechanical tests The consigner or carrier shall be liable for the damage to instrument resulting from shipment RIGOL would not be responsible for free maintenance rework or replacement of the un...

Page 36: ...y releasing latches at both sides and sliding in the direction of the arrows as shown in the figure below Figure 1 14 Disassemble the front panel cover 1 3 3 Adjust the Supporting Legs If necessary ad...

Page 37: ...able battery China only for power supply 1 3 4 1 Connect the AC Power Please use the power cord provided for AC powering see figure below For the AC voltage and frequency requirements refer to Rear Pa...

Page 38: ...he installation status and the current amount of electricity of the battery Green battery electricity 80 Orange 20 battery electricity 80 Red battery electricity 20 Off the battery is not installed or...

Page 39: ...r on Upon completion of the initialization process a sweep curve would be displayed 1 3 6 Self Calibration Press System Calibrate Cal Now to use internal calibration resources to calibrate the system...

Page 40: ...power and remove the power cord 2 Prize out the fuse holder using a small straight screwdriver 3 Take out the fuse 4 Replace the old fuse with a specified one 5 Re install the fuse holder Figure 1 19...

Page 41: ...state The battery status indicator at the front panel indicates the charge progress If the battery status indicator does not go on the battery contains no electricity currently If the battery status...

Page 42: ...37 38 41 40 39 42 Figure 1 20 User interface Table 1 3 User interface legends NO Name Description 1 LOGO Logo of RIGOL company 2 System status UNCAL and Identification are in different locations Auto...

Page 43: ...Function of current menu belongs to 12 Menu item Menu item of current function 13 Reference level Reference level 14 Active area Current parameter and value 15 Attenuator settings Sets the Attenuator...

Page 44: ...top frequency 31 Y scale Label of Y scale 32 Parameter status Icons on the left side of the screen indicate the status of system parameters 33 Detection type Pos peak Neg peak Sample Normal RMS Avg Vo...

Page 45: ...inued NO Name Description 41 Trace 3 types and status Trace types Clear Write Max Hold Min Hold Video Avg and Power Avg Trace status light blue denotes On and gray denotes Off 42 MATH trace types and...

Page 46: ...the keyboard and select the desired unit from the pop up unit menu or unit keys You can also press Enter to select the default unit MHz Press corresponding menu key to switch the sub option shown For...

Page 47: ...be set to the frequency of the current peak signal Press corresponding menu key to switch between functions change parameter directly from the keyboard For example press CF Step and switch between Au...

Page 48: ...ble to be used 2 Decimal point A decimal point will be inserted at the cursor position when this key is pressed 3 Sign key Sign key is to toggle the sign of a parameter When pressed the first time a w...

Page 49: ...n while it is locked 7 Back 1 During the process of parameter editing this key will delete the characters on the left side of the cursor 2 While in the process of file name editing pressing this key w...

Page 50: ...lowing functions 1 Increase or decrease the parameter value at specific steps while editing a parameter 2 Move the cursor among root directory in Storage function 3 Select the character in the upper o...

Page 51: ...parameters to factory settings 3 Equipment Connection Connect the signal output terminal of generator to the RF INPUT 50 terminal at the front panel of analyzer 4 Setup the Center Frequency 1 Press F...

Page 52: ...es Reference Level is active 2 Reference level could be changed through the numerical keyboard the knob or the directional keys 3 If necessary you can change the reference level using the knob so as t...

Page 53: ...rument and PC Provide stronger data storage and process capability through PC For detailed information about installation and use of Ultra Spectrum refer to the related user s guide 1 9 How to Use the...

Page 54: ...out how to obtain help information will be shown then press the menu keys to get corresponding help 5 Acquire the help information of any function key Press Help a message about how to obtain help inf...

Page 55: ...pull down menus Note that a third class title such as 2 1 1 FREQ always denotes a panel key of the analyzer while a quaternary title such as 2 1 1 1 Center Freq always denotes a menu softkey of a pan...

Page 56: ...the center frequency the stop frequency the start frequency and the span respectively 2 1 1 1 Center Freq Sets the center frequency of the sweep When pressed the frequency mode is switched to Center...

Page 57: ...lower left and right side of the grid Key Points The span and center frequency are changed automatically according to the start frequency The change of the span would have influence on other system p...

Page 58: ...er Input Table 2 3 Stop frequency Parameter Explanation Default 3 GHz Range 0 Hz to 3 GHz Unit GHz MHz kHz Hz Knob Step Span 0 step Span 200 Span 0 step VBW 100 Min 1 Hz Direction Key Step CF step Not...

Page 59: ...is in Non zero span mode or equals the RBW while in Zero span mode in Manual mode you can set the step using the numeric keys After you set an appropriate CF step and select center frequency you can...

Page 60: ...harmonics sequentially at the center of the screen 2 1 1 6 Signal Track Tracks signals with unstable frequency and less than 3 dB transient variation in amplitude by placing the Marker1 see Marker Mea...

Page 61: ...the signal at the center of the screen If no marker is active when Signal Track is enabled the instrument will activate Marker 1 execute a peak searching automatically set the frequency of the current...

Page 62: ...ent center frequency as the CF step This function is usually used with channel switching Take harmonic waveform measurements for example we can locate a signal at the center frequency of a channel exe...

Page 63: ...be set down to 100 Hz the only way into the zero span mode is to press the Zero Span menu option and up to the full span described in Specification Modifying the span in non zero span mode may cause a...

Page 64: ...point Key Points As opposed to the Non zero span the screen shows the time domain characteristics of the fixed frequency component and following functions are invalid in Zero span mode FREQ Peak CF Si...

Page 65: ...at an optimal view with minimum error 2 1 3 1 Auto Scale This setting enables the readout resolution of the current Y axis to be the maximum possible on condition that the whole signal is within the s...

Page 66: ...x mixing level respectively You can modify this parameter using the numeric keys knob or direction keys For more details please refer to Parameter Input Table 2 7 Reference level Parameter Explanation...

Page 67: ...2 1 3 4 Scale Div Sets the logarithmic units per vertical grid division on the display Key Points By changing the scale the displayed amplitude range is adjusted The amplitude that can be displayed is...

Page 68: ...value shown at the top of the grid is the reference level and the bottom of the grid shows 0 V The grid size is 10 of the Reference level and the Scale Div is invalid The unit of Y axis will be automa...

Page 69: ...device under measurement and the analyzer Key Points The changing of this value changes both the readout of the reference level and the amplitude readout of the marker but will not impact the position...

Page 70: ...hin the specified span range automatically in order to display the whole signal optimally on the grid Figure 2 6 Before the Auto Range Figure 2 7 After the Auto Range Key Points Unlike Auto Scale this...

Page 71: ...detected signals are at the center frequency Start Peak Search Adjust Ref Level Peak Ref Level Decrease Max Mixer Level Stop Increase Max Mixer Level Big Signal Auto Scale Y Y N N Figure 2 8 Process o...

Page 72: ...the amplitude correction the default is Off When you enable the Correction the system starts correcting the amplitude with a specified factor If more factors are added all related data will be used f...

Page 73: ...Sets the max input level of mixer according to the magnitude of signal Key Points For a bigger input signal choosing a smaller max mixing level can increase the input attenuation and reduce the disto...

Page 74: ...nce for voltage to power conversions see Equation 2 4 The default is 50 To measure a 75 device you should use a 75 to 50 adapter supplied by RIGOL to connect the analyzer with the system under test an...

Page 75: ...se the frequency resolution but may also cause sweeps to take longer Sweep Time is effected by a combination of RBW and VBW when it is in Auto mode RBW decreases with the span non zero span in Auto RB...

Page 76: ...1 3 10 sequence Direction Key Step in 1 3 10 sequence 2 2 1 3 V R Ratio Sets the ratio of VBW to RBW Key Points This value is different while measuring different kinds of signals Sine signal use 1 3 f...

Page 77: ...er type Key Points DSA1000 supports two kinds of RBW filters Gauss 3 dB bandwidth and EMI 6 dB bandwidth When EMI is selected resolution bandwidth can be 200 Hz 9 kHz 120 kHz or 1 MHz only The default...

Page 78: ...wever an error may be caused if the specified time is less than the minimum duration in Auto coupling and UNCAL is shown at the status bar of the screen You can modify this parameter using the numeric...

Page 79: ...rom the parameter icon is the abbreviation of the Continue which denotes the analyzer is sweeping continuously Single the number 10 from the parameter icon denotes the current sweep number 2 2 2 4 Num...

Page 80: ...ic keys knob or direction keys For more details please refer to Parameter Input Table 2 18 Points Parameter Explanation Default 601 Range 101 to 3001 Unit N A Knob Step 1 Direction Key Step 100 Hint T...

Page 81: ...2 2 3 Auto Tune Searches for signals automatically throughout the full frequency range adjusts the frequency and amplitude to their optimum and realizes one key signal search and auto setting of param...

Page 82: ...the backlight of Auto Tune turns on and Auto Tune is shown on the status bar of the screen until the search is finished In Auto mode press Auto Tune to stop the search The magnitude of some parameter...

Page 83: ...ects a video signal in which the voltage exceeds the specified video trigger level This function is invalid in one of the three conditions which are non zero span mode RMS Avg detection and Voltage Av...

Page 84: ...00 Series Table 2 19 Trigger level Parameter Explanation Default 0 dBm Range 300 dBm to 50 dBm Unit dBm Knob Step 1 dBm Direction Key Step 10 dBm Note This is in connection with the specified unit of...

Page 85: ...l trigger conditions are satisfied If the system is already in Single sweep mode pressing this key will execute specified number of sweeps or measurements on the condition that all trigger conditions...

Page 86: ...fied If the instrument is in Single sweep mode and a measurement function is on pressing this key will enter the Continue sweep mode and execute specified number of measurements on the condition that...

Page 87: ...g a wider span each pixel contains spectrum information associated with a larger subrange That is several samples may fall on one pixel Which of the samples will be represented by the pixel depends on...

Page 88: ...n the left status bar of screen see below 2 3 1 1 Pos Peak Searches the maximum from the sampling data segment and displays it at the corresponding pixel 2 3 1 2 Neg Peak Searches the minimum from the...

Page 89: ...ed N i RMS v N V 1 i 2 1 Equation 2 8 Where RMS V RMS value of voltage in V N number of samples assigned for every pixel i v envelop of the samples in V The reference resistance R can be used for calc...

Page 90: ...he peaks detected are weighted using circuit with specified charge and discharge structures as well as the display time constant specified in the CISPR Publication 16 standards and the result is displ...

Page 91: ...and Clear Write 2 3 2 2 Trace Type Sets the type of the current trace or disables it The system calculates the sample data using a specific operation according to the selected type and displays the re...

Page 92: ...type is generally used by traces from the storage devices or remote interface as default 7 Blank Disables the trace display and all measurements under this trace 2 3 2 3 Average Times Sets the number...

Page 93: ...s Trace 2 4 Constant Sets the value of the constant You can use the numeric keys to modify this parameter please refer to Parameter Input for more details Table 2 21 Constant in math operation Paramet...

Page 94: ...L Front Panel Key Reference 2 40 User s Guide for DSA1000 Series 2 3 2 6 AVG Reset Re calculates the trace average Note This function is only available when the trace type is set to Video Avg or Power...

Page 95: ...modulation signal through an audio frequency AF The frequency and intensity of the audio respectively denotes the frequency and intensity of the modulation signal 2 3 3 2 Demod Setup 1 Speaker Sets th...

Page 96: ...his parameter For more details please refer to Parameter Input Table 2 23 Demod Time Parameter Explanation Default 100 ms Range 5 ms to 1000 s Unit ks s ms us ns ps Knob Step 0 to 100 ms step 1 ms 100...

Page 97: ...ower Sweep is Off The Source function is valid only when the instrument is DSA1030 TG 2 3 4 2 TG level Sets the output power of the signal from the tracking generator TG In Power Sweep mode this param...

Page 98: ...set Parameter Explanation Default 0 dB Range 200 dB to 200 dB Unit dB Knob Step 1 dB Direction Key Step 10 dB 2 3 4 4 Power Sweep Enables or disables the power sweep function If enabled the power from...

Page 99: ...lt 0 dB Range 0 dB to 20 dB Unit dB Knob Step 1 dB Direction Key Step 10 dB 2 3 4 6 Freq Offset Sets the offset between the TG signal frequency and the current sweep frequency of the analyzer Key Poin...

Page 100: ...alue of reference trace after every sweep 3 Reference level Adjusts the vertical position of trace on the screen when normalization is On Being different from the Reference level function upon the AMP...

Page 101: ...0 to 100 Unit Knob Step 1 Direction Key Step 10 5 Ref Trace Sets whether to display the reference trace or not If View is selected the reference trace saved Trace 3 will be shown in the trace type of...

Page 102: ...he basic measurement displaying with a sweep trace and the lower window holds the results Through the Screen Control key you can switch between different windows and zoom the window 1 T Power Enables...

Page 103: ...l falls off X dB within the span range Select the EBW measurement and press Meas Setup to set corresponding parameters 6 C N Ratio Measures the power of both the carrier and noise within specified ban...

Page 104: ...se Suspends the measurement after current measurement However the sweep is continuous when pressed an icon is shown on the results window and the measurement data stops updating 2 4 1 4 Resume Restart...

Page 105: ...measurement Result Magnitude of T Power That is the signal power value from the start to stop line Parameters In this mode setting parameters are Avg Num Avg Mode TP Type Start Line and Stop Line 1 A...

Page 106: ...power value of the maximum signal between the start and stop lines The detector in this type is changed to Pos Peak automatically Average Displays the average power of the signals between the start an...

Page 107: ...e Sets the right margin when measuring the T Power using the time units The data calculated under this measurement is from the start to stop line You can use the numeric keys knob or direction keys to...

Page 108: ...up in frequency and the difference with the main channel Unit is dBc Lower displays the power value of the next channel down in frequency and the difference with the main channel Unit is dBc Paramete...

Page 109: ...th of the main channel The power of the main channel is the power integral within this bandwidth You can use the numeric keys knob or direction keys to modify this parameter For more details please re...

Page 110: ...CH Spacing Sets the spacing between the main and adjacent channels Changing this parameter may adjust the channel distance from the main to the upper and lower You can use the numeric keys knob or dir...

Page 111: ...er within the integral bandwidth Power Spectral Density the power which is normalized to 1 Hz within the integral bandwidth Unit is dBm Hz Parameters In this mode setting parameters are Avg Num Avg Mo...

Page 112: ...power integral within this bandwidth You can use the numeric keys knob or direction keys to modify this parameter For more details please refer to Parameter Input Table 2 38 Integral bandwidth of Chan...

Page 113: ...uide for DSA1000 Series 2 59 Table 2 39 The Channel span of Chan Pwr measurement Parameter Explanation Default 3 MHz Range 100 Hz to 3 GHz Unit GHz MHz kHz Hz Knob Step CH Pwr Span 100 Min 1 Hz Direct...

Page 114: ...ole span and then work out the occupied bandwidth of it according to the specified power ratio Transmit Freq Error the center frequency difference between the measured channel and the analyzer Paramet...

Page 115: ...d On always displays the maximum measurement result Hold Off displays the current measurement result This function and Avg Mode are mutually exclusive options if you enable the Max Hold the Avg Mode w...

Page 116: ...the signal that is within the integrating span You can use the numeric keys knob or direction keys to modify this parameter For more details please refer to Parameter Input Table 2 42 The Power Ratio...

Page 117: ...alyzer first confirms the frequency f0 of the max amplitude point within the span range and then starts searching for the points f1 and f2 on both sides with X dB drop in amplitude The EBW is equal to...

Page 118: ...he default is Off Hold On always displays the maximum measurement result Hold Off displays the current measurement result This function and Avg Mode are mutually exclusive options if you enable the Ma...

Page 119: ...f X dB to calculate the emission bandwidth You can use the numeric keys knob or direction keys to modify this parameter For more details please refer to Parameter Input Table 2 45 X dB Parameter Expla...

Page 120: ...r bandwidth Noise Pwr the power within noise bandwidth C N Ratio the ratio of the carrier power to the noise power Parameters In this mode setting parameters are Avg Num Avg Mode Offset Freq Noise BW...

Page 121: ...the current N specified by Avg Num measurements 3 Offset Freq Sets the center frequency difference between the carrier and the noise You can use the numeric keys knob or direction keys to modify this...

Page 122: ...BW Sets the bandwidth of the carrier for measurement This value is related to the Noise BW which can be set within Noise BW 20 and 20 Noise BW You can use the numeric keys knob or direction keys to m...

Page 123: ...he amplitude of each harmonic and THD Up to 10 times harmonics can be measured Parameters In this mode setting parameters are Avg Num Avg Mode NO of Harmo and Harmonic ST Sweep Time 1 Avg Num Sets the...

Page 124: ...e current N specified by Avg Num measurements 3 NO of Harmo Sets the number of harmonics to be measured which is used for calculating the total harmonics You can use the numeric keys knob or direction...

Page 125: ...de for DSA1000 Series 2 71 Table 2 52 The Sweep Time of Harmo Dist measurement Parameter Explanation Default 10 ms Range 20 us to 3 ks Unit ks s ms us ns ps Knob Step Sweep Time 100 minimum 1 ms Direc...

Page 126: ...Lower and 3rd Order Upper signals the amplitude difference of each signal with the Base Lower as well as the Intercepts of both the Base Lower and Base Upper Parameters In this mode setting parameter...

Page 127: ...easurements In Repeat mode the result is the arithmetic average of the current N specified by Avg Num measurements 3 Span This value equals the span of the analyzer indicating the frequency range of s...

Page 128: ...es including Upper and Lower and then sets the condition according to the Edit menu Note T2 and T3 here are used for marking the Upper and Lower limits separately 2 Test Enables or disables the test f...

Page 129: ...ted Connects this point with the previous one or not Del Point Deletes the point you are editing 4 X Axis Sets the Frequency or Time unit as the X axis s Note the switch of units may delete all the ed...

Page 130: ...the trace such as the amplitude frequency and sweep time Figure 2 24 Schematic of the marker Key Points The analyzer allows for up to four groups of markers to be displayed at one time but only one pa...

Page 131: ...r of Pixels in the Grid Area 1 Readout Time or 1 time step Sweep Time Min Sweep Points Number of Pixels in the Grid Area 1 Direction Key Step Readout Frequency or Period step Span 10 Readout Time or 1...

Page 132: ...ce which are the Reference Marker marked as a combination of the marker number and letter R such as 1R and the Delta Marker marked as the marker number such as 1 Key Points The Reference Marker will b...

Page 133: ...r marked as the marker number such as 1 Key Points You can use the knob direction keys or numeric keys to set the location of the Reference Marker selecting Ref and the Delta Marker selecting Delta Th...

Page 134: ...ed off 2 5 1 7 Mkr Trace Selects a trace to be used on the current marker from 1 2 3 Math or Auto default When Auto is selected the system searches the desired trace in the order of Clear Write Max Ho...

Page 135: ...o span mode is Time 4 1 Time In this type the reciprocal value of sweep time difference between the Delta Marker and Reference Marker will be shown When the time difference is zero the displayed value...

Page 136: ...2 Marker Sets the other system parameters such as Center frequency Reference level using the current marker readings Press Marker to enable a marker if none of them are active at present 2 5 2 1 Mkr C...

Page 137: ...ed The function is invalid in Zero span mode 2 5 2 3 Mkr Start Sets the start frequency of the analyzer based on the frequency of the current marker If Normal is selected the start frequency will be s...

Page 138: ...d 2 5 2 6 Mkr CF Sets the center frequency of the analyzer to the frequency difference between the two markers in the marker type of Delta Delta Pair or Span Pair The function is invalid in Zero span...

Page 139: ...en normalize this value to 1 Hz bandwidth During this process certain compensation is always taken on the basis of different detection and trace types The measurement will be more precise if using the...

Page 140: ...two points or else display indicating the search failed You can use the numeric keys knob or direction keys to modify the value of N for more details please refer to Parameter Input Table 2 57 N dB B...

Page 141: ...Parameter Explanation Default 1 kHz Range 1 Hz to 100 kHz Unit GHz MHz kHz Hz Knob Step 10 times Direction Key Step 10 times 2 5 4 Peak Executes peak searching immediately and opens the Peak setting...

Page 142: ...d to the left side of the current peak and meets the searching condition The peak is then identified with a marker 2 5 4 4 Min Search Searches the peak with the minimum amplitude on the trace and iden...

Page 143: ...ions of peak search for various peak searching A real peak should meet the value of both PK Excursn and PK Thresh 1 PK Excursn Sets the excursion between the peak and the minimum amplitude on both sid...

Page 144: ...aning only for the peak search which will be executed when pressing the Peak key on the front panel while other searches such as Next Peak Peak Right Peak Left and Min Search are all based on the Para...

Page 145: ...conditions but also have an amplitude smaller than the specified Display Line from Display menu in the table 2 5 5 L Peak The shortcut key of the Left peak measurement which has the same function as...

Page 146: ...e 2 6 1 2 Reset Selects the instrument settings to be recalled after the analyzer is powered on The power on setting includes Last and Preset and Preset has two types Factory and User 1 Power On Sets...

Page 147: ...the menu key is pressed 2 Self Cal This function drives the analyzer to perform a regular self calibration according to the environmental temperature so as to compensate for the system error 2 6 1 4...

Page 148: ...5 254 and a fixed subnet mask 255 255 0 0 automatically Manual IP one of the setting methods of IP address In this type users can define a desired IP address for the analyzer IP Sets the IP address su...

Page 149: ...o as to decrease the frequency deviation 1 Internal Reference Source When internal reference source is in use a reference signal that enables synchronization to other devices will be outputted from th...

Page 150: ...Step This parameter maintains a coupling relationship with the RBW or span in zero span or non zero span mode Refer to CF Step for more details 2 Reference level This parameter maintains a coupling re...

Page 151: ...Board FPGA Version of Digital Board FPGA Version of Embedded Software 2 System Message Views the system messages that have appeared recently up to 71 items For more information about the system messa...

Page 152: ...shown from the interface of the analyzer lights when some panel key is pressed this indicates that the key you pressed is in normal service or else an error may have occurred in this key Note if the k...

Page 153: ...on 1 License Press License to open the input box and input the option license using the numeric keys and knob at the front panel For example 646K204P69N0P0395P899156121M2M9OKO4L056728N399PO After ente...

Page 154: ...ference of which the amplitude is equal to the set value and the amplitude has the same unit with the selected unit from Units You can modify this parameter using the numeric keys knob or direction ke...

Page 155: ...aticule Parameter Explanation Range 0 to 10 Unit N A Knob Step 1 Direction Key Step 1 2 6 2 5 Scr Saver Sets the latency before the screen enters the Screen Saver mode after the analyzer becomes idle...

Page 156: ...e analyzer You can modify this parameter using the numeric keys knob or direction keys For more details please refer to Parameter Input Table 2 64 Brightness setting Parameter Explanation Range 0 to 7...

Page 157: ...display 2 6 2 9 Msg Switch Enables or disables the display of messages The types of messages in this analyzer include Information Message Error Message and Status Message Only Information Messages ap...

Page 158: ...Preset to load Factory settings except for items marked with listed in the following table or User defined settings Table 2 65 Factory Default Parameter Default Frequency Center Freq 1 5 GHz Start Fre...

Page 159: ...Auto 100 ms Auto SWT Normal Mode Cont Numbers 1 Points 601 Source TG Off Power Sweep Off Ref Trace Off Freq Offset 0 Hz TG Level 0 dBm TG Lvl Offset 0 dB Normalize Off Norm Ref Lvl 0 dB Norm Ref Pos 1...

Page 160: ...er Avg Num Off 10 Avg Mode Exp Integ BW 2 MHz CH Pwr Span 3 MHz OBW Avg Num Off 10 Avg Mode Exp Max Hold Off OBW Span 2 MHz Power Ratio 99 EBW Avg Num Off 10 Avg Mode Exp Max Hold Off EBW Span 2 MHz E...

Page 161: ...No Freq Interp Lin Fail Stop On Trace Select Trace 1 Trace Type of Trace 1 Clear Write Avg Times 100 Function A B A T1 B T2 Const 0 Math Operate Off Marker Select Mkr 1 Mkr Type Normal Mkr Trace Auto...

Page 162: ...B Address 18 Ref Source Int Probe Power Off Front Switch On Information System Info Status Analyzer Time Date On Self Cal On Storage File Type State Format BIN File Source T1 Browser Dir Input Style E...

Page 163: ...L User s Guide for DSA1000 Series 2 109 Page Size Default Inverted Off Palette Gray Copies 1 Date Prints Off Qualities Default File Type Default Note For DSA1030 TG only Not affected by pressing Prese...

Page 164: ...analyzer or external USB storage devices Press Storage to enter the file operation manager see figure below Figure 2 32 File operation manager Icons in the manager are Table 2 66 File icons Icon Expl...

Page 165: ...the amplitude correction table the frequency and amplitude of the correction point the trace data currently used at most 4 and the marker information marker readout mode marker readout and display st...

Page 166: ...use is an external USB storage device 2 6 4 4 Browser Sets the browser type You can switch among the directory or file by using the direction keys or the knob 2 6 4 5 Save Saves a file into the extern...

Page 167: ...file or folder 2 Copy To Performs the paste operation of a directory or file Note When the current directory already contains a file or folder with the same name a backup copy will be created with the...

Page 168: ...file system the used space and the total space 2 6 4 14 Name Prefix 1 Prefix Switch Enables or disables the edited prefix name The input box will automatically load the prefix name after you press Sav...

Page 169: ...Uses the USB cable provided in the accessories to connect the analyzer with the PictBridge printer 3 Then PictBridge printer connected is shown on the screen to prompt you that the instrument now is i...

Page 170: ...in progress Print has been paused 2 6 5 1 Print Prints the measurement data according to current setting parameters when the printer has been successfully installed and is in idle state 2 6 5 2 Resum...

Page 171: ...alyzer allows for up to 999 copies to be printed at one time 2 6 5 9 Date Prints Turns on or off the date print 2 6 5 10 Qualities Selects print quality to Normal Draft Fine or Default The default qua...

Page 172: ...ify the characteristics of the printer such as Page size during the printer installation If some configuration is not supported by the current printer the corresponding menu in the analyzer is invalid...

Page 173: ...onnected When no printer is connected but an USB storage device is detected this operation saves the current screen as a specified file name to the root directory of USB storage device If neither a pr...

Page 174: ...he left side of the screen would be displayed see figure below so that you can view the trace more clearly To exit full mode press this key again Figure 2 34 Full screen display Key Points Pressing an...

Page 175: ...window is highlighted see figure below Figure 2 35 Switch between windows Key Points Pressing described in the following section will zoom in on the selected window so that you can observe the trace o...

Page 176: ...d window by pressing The selected window will be zoomed in at the first press of this key To exit this mode press this key again Hint The screen can be divided into two windows when one of the these f...

Page 177: ...y Counter Measuring an AM Signal Measuring the Phase Noise Measuring the N dB Bandwidth Measuring the Time Domain Power Measuring the Adjacent Channel Power Measuring the Channel Power Measuring the O...

Page 178: ...the output terminal of the generator to the RF INPUT 50 terminal on the front panel of the analyzer 2 Use Marker to measure 1 Reset the analyzer Press Preset 2 Set the parameters Press FREQ Press Cent...

Page 179: ...Measurement Examples RIGOL User s Guide for DSA1000 Series 3 3 Figure 3 1 Measuring a Sine signal...

Page 180: ...se the frequency counter to measure 1 Reset the analyzer Press Preset 2 Set the parameters Press FREQ Press Center Freq and enter 100 MHz Press SPAN Press Span and enter 10 MHz 3 Open a marker Press M...

Page 181: ...Measurement Examples RIGOL User s Guide for DSA1000 Series 3 5 Figure 3 2 Use the frequency counter to measure...

Page 182: ...Device attachment Connect the output terminal of the generator to the RF INPUT 50 terminal on the front panel of the analyzer 2 Measuring in zero span 1 Reset the analyzer Press Preset 2 Set the para...

Page 183: ...Measurement Examples RIGOL User s Guide for DSA1000 Series 3 7 signal 3 Measurement result The result is 1 kHz see figure below Figure 3 3 Measure an AM signal...

Page 184: ...Span and enter 10 MHz 3 Demodulate the signal Press Demod Press Demod and enter the lower menu Press AM to turn on AM demodulation function The frequency can be described by the acuity level of the sp...

Page 185: ...he analyzer 2 User the noise marker to measure 1 Reset the analyzer Press Preset 2 Set the parameters Press FREQ Press Center Freq and enter 50 MHz Press SPAN Press Span and enter 50 kHz Press BW Pres...

Page 186: ...RIGOL Measurement Examples 3 10 User s Guide for DSA1000 Series Figure 3 4 Phase noise measurement...

Page 187: ...front panel of the analyzer 2 Use the N dB bandwidth measurement function 1 Reset the analyzer Press Preset 2 Set the parameters Press FREQ Press Center Freq and enter 100 MHz Press SPAN Press Span a...

Page 188: ...RIGOL Measurement Examples 3 12 User s Guide for DSA1000 Series Figure 3 5 N dB bandwidth measurement result...

Page 189: ...nt Connect the output terminal of the generator to the RF INPUT 50 terminal on the front panel of the analyzer 2 Measure the time domain power 1 Reset the analyzer Press Preset 2 Set the parameters Pr...

Page 190: ...RIGOL Measurement Examples 3 14 User s Guide for DSA1000 Series Figure 3 6 Time domain power measurement...

Page 191: ...he front panel of the analyzer 2 Measure the adjacent channel power 1 Reset the analyzer Press Preset 2 Set the parameters Press FREQ Press Center Freq and enter 100 MHz Press Meas Press Meas Fctn and...

Page 192: ...RIGOL Measurement Examples 3 16 User s Guide for DSA1000 Series Figure 3 7 Adjacent channel power measurement result...

Page 193: ...ect the output terminal of the generator to the RF INPUT 50 terminal on the front panel of the analyzer 2 Measure the channel power 1 Reset the analyzer Press Preset 2 Set the parameters Press FREQ Pr...

Page 194: ...RIGOL Measurement Examples 3 18 User s Guide for DSA1000 Series Figure 3 8 Channel power measurement result...

Page 195: ...onnect the output terminal of the generator to the RF INPUT 50 terminal on the front panel of the analyzer 2 Measure the power distribution 1 Reset the analyzer Press Preset 2 Set the parameters Press...

Page 196: ...RIGOL Measurement Examples 3 20 User s Guide for DSA1000 Series Figure 3 9 Occupied bandwidth measurement result...

Page 197: ...attachment Connect the output terminal of the generator to the RF INPUT 50 terminal on the front panel of the analyzer 2 Measure the emission bandwidth 1 Reset the analyzer Press Preset 2 Set the para...

Page 198: ...RIGOL Measurement Examples 3 22 User s Guide for DSA1000 Series Figure 3 10 Emission bandwidth measurement result...

Page 199: ...inal of the generator to the RF INPUT 50 terminal on the front panel of the analyzer 2 Measure the signal over the C N Ratio function 1 Reset the analyzer Press Preset 2 Set the parameters Press FREQ...

Page 200: ...RIGOL Measurement Examples 3 24 User s Guide for DSA1000 Series Figure 3 11 C N Ratio measurement result...

Page 201: ...arker to measure 1 Reset the analyzer Press Preset 2 Set the parameters Press FREQ Press Center Freq and enter 200 MHz Press Stop Freq and enter 400 MHz Press BW Press RBW and enter 100 kHz Now you ca...

Page 202: ...at the fundamental wave while the Delta is at the third harmonic The measured value would be the frequency offset is 200 MHz and the amplitude difference is 40 45 dB 3 Measurement result The fundament...

Page 203: ...e 1 Reset the analyzer Press Preset 2 Set the parameters Press FREQ Press Center Freq and enter 100 MHz Press Meas Press Meas Fctn and enter the lower menu Page down Press Harmo Dist 3 Modify the harm...

Page 204: ...RIGOL Measurement Examples 3 28 User s Guide for DSA1000 Series Figure 3 13 Harmonic Distortion measurement result...

Page 205: ...ker function to measure Procedures 1 Device attachment Connect the output terminals of generators 1 2 to the RF INPUT 50 terminal on the front panel of the analyzer through a power combiner 2 Measure...

Page 206: ...utput terminals of generators 1 2 to the RF INPUT 50 terminal on the front panel of the analyzer through a power combiner 2 TOI function to measure 1 Reset the analyzer Press Preset 2 Set the paramete...

Page 207: ...ult The measurement results shown in the lower window are Freq dBm dBc Intercept Base Lower 100 MHz 5 7 dBm 0 Base Upper 100 2 MHz 5 65 dBm 0 05 3rd Order Lower 99 8 MHz 60 16 dBm 54 46 21 53 3rd Orde...

Page 208: ...onnect the output terminal of the generator to the RF INPUT 50 terminal on the front panel of the analyzer 2 Measure the signal over the Pass Fail function 1 Reset the analyzer Press Preset 2 Set the...

Page 209: ...s 3 99 5 MHz 5 dBm Yes 4 100 5 MHz 5 dBm Yes 5 101 MHz 55 dBm Yes 6 105 MHz 55 dBm Yes 4 Turn on the test Press Meas Setup Press Limit and select Upper Press Test and select On Press Limit and select...

Page 210: ...ct Press Antenna 3 Open amplitude correction Press Correction to enable or disable the amplitude correction Press Corr Table to turn on or off the correction table 4 Edit the correction points Press E...

Page 211: ...Measurement Examples RIGOL User s Guide for DSA1000 Series 3 35 Figure 3 17 Amplitude correction...

Page 212: ...response of a filter 1 Reset the analyzer Press Preset 2 Set the parameters Press FREQ Press Stop Freq and enter 1GHz Press Source Press TG and select On 3 Normalization Connect the RF INPUT 50 termi...

Page 213: ...Measurement Examples RIGOL User s Guide for DSA1000 Series 3 37 Figure 3 18 The frequency response of a filter...

Page 214: ......

Page 215: ...s and programming refer to the Programming Guide Use PC software to send SCPI commands Users can use the PC software Ultra Sigma of RIGOL to send SCPI commands to control the spectrum analyzer remotel...

Page 216: ...stalled on your PC after you connect the analyzer to the PC and turn both on 3 Search device resource Start up Ultra Sigma and the software then starts searching the analyzer resources that have been...

Page 217: ...3 5 Communication test Right click the resource name such as DSA1030 USB0 0x0400 0x09C4 DSA1A124400148 INSTR and select SCPI Panel Control to open the interface below from which you can write and rea...

Page 218: ...nterface according to the description in I O Settings LAN 3 Search device resource Start up Ultra Sigma and click then click in the pop up window the software starts seaching the analyzer resources co...

Page 219: ...are shown in the RIGOL Online Resource catalog See figure below Figure 4 4 View the resource 5 Communication test Right click the resource name such as DSA1030 TCPIP 172 16 3 148 INSTR and select SCPI...

Page 220: ...e you can see some important information about the analyzer such as the model manufacturer serial number MAC address IP address and other description As shown in the figure below Figure 4 6 LXI Webpag...

Page 221: ...1 4 I O Settings GPIB 4 Search device resource Start up the Ultra Sigma and click to enter the following interface Then click Search and the software starts searching the analyzer resources that that...

Page 222: ...ave been searched successfully at present are shown in the RIGOL Online Resource catalog Figure 4 8 View the GPIB resource 6 Communication test Right click the resource name such as DSA1030 GPIB0 1 IN...

Page 223: ...e front panel goes on if not the battery contains no electricity and please charge the battery 3 If AC power is used for power supply Check if the power supply has been connected correctly and power s...

Page 224: ...t appropriately and operate within the specified environment and temperature 4 Calibrate the instrument regularly to reduce or avoid errors that can occur over time Press System Information System Inf...

Page 225: ...f this error massage Error Messages based on the cause of the error are divided into Command Error Execution Error Device Specific Error or Query Error Each of the errors corresponds to a specific bit...

Page 226: ...2 6 5 7 fails to follow the Message Exchange Control Protocol under any of the conditions below see IEEE488 2 6 1 10 When trying to read the output queue the queue has no data or is being suspended D...

Page 227: ...rinting please select Cancel to stop the print job 7 Printing task canceled 8 Printing task resumed 10 USB Disk connected The USB storage device has already been connected and is waiting for initializ...

Page 228: ...d to delete folder 56 Fail to load file 57 Local Disk is being Formatted please wait for a moment 58 Formatting is finished 60 Software version is not matched file loading is failed 61 Invalid source...

Page 229: ...g was received when the device does not accept strings 103 Invalid separator The parser was expecting a separator and encountered an illegal character for example the semicolon was omitted after a pro...

Page 230: ...lid 115 Unexpected number of parameters The number of parameters received does not correspond to the number of parameters expected This is typically due an inconsistency with the number of instruments...

Page 231: ...used if the device cannot detect a more specific error 141 Invalid character data Either the character data element contains an invalid character or the particular element received is not valid for t...

Page 232: ...not detect a more specific error 171 Invalid expression The expression data element was invalid see IEEE 488 2 7 7 7 2 for example unmatched parentheses or an illegal character 178 Expression data not...

Page 233: ...e cannot detect the more specific errors described for errors 221 through 229 221 Settings conflict Indicates that a legal program data element was parsed but could not be executed due to the current...

Page 234: ...ould be used when the device cannot detect the more specific errors described for errors 251 through 258 251 Missing mass storage Indicates that a legal program command or query could not be executed...

Page 235: ...Troubleshooting RIGOL User s Guide for DSA1000 Series 5 13 Indicates that a legal program command or query could not be executed because the write protect tab on USB storage device was present...

Page 236: ...ase report the error to your RIGOL sales or technical support team 313 Calibration memory lost Indicates that the data before delivery or last valid calibration data has been lost Please report the er...

Page 237: ...print file type 304 Unknown print error 310 Updating error with wrong image file An error occurred when updating firmware owing to a wrong format of the image file or the file has already been damaged...

Page 238: ...failed Failed to configure IP address with DHCP server Please try manual IP 341 IP conflict The IP address received is in conflict with another computer on the network Please try another IP address 3...

Page 239: ...is out of range if this state continues for a long time some damage may occur to the device Please reduce the input power 401 1st LO unlock The first LO unlock Please report the error to your RIGOL sa...

Page 240: ...GOL Troubleshooting 5 18 User s Guide for DSA1000 Series 462 No two tune signal found 463 Invalid function as cursor is not enabled The cursor can not be set to the reference level unless it is enable...

Page 241: ...B or GET before a response was completely sent 420 Query UNTERMINATED Indicates that a condition causing an UNTERMINATED Query error occurred see IEEE 488 2 6 3 2 2 for example the device was addresse...

Page 242: ...umber Error Description 202 Auto range 203 Auto tune 204 Calibrating 205 Waiting for triggered If it is not in freerun mode the system will keep waiting until it receives the trigger signal 252 Auto r...

Page 243: ...d and does not include the measurement uncertainty Nominal Value the expected average performance or a designed attribute such as the 50 connector This data is not warranted and is measured at room te...

Page 244: ...arker Resolution span sweep points 1 Marker Uncertainty frequency indication frequency reference uncertainty 1 span 10 resolution bandwidth marker resolution Marker Frequency Counter Resolution 1 Hz 1...

Page 245: ...Filter Shape Factor 60 dB 3 dB 5 nominal Video Bandwidth 3 dB 1 Hz to 3 MHz in 1 3 10 sequence 6 1 2 Amplitude Measurement Range DSA1030 Range 10 MHz to 3 GHz DANL to 30 dBm 1 MHz to 10 MHz DANL to 2...

Page 246: ...f 1 MHz dB typical 133 dBm 10 MHz to 2 5 GHz 135 dBm 3 x f 1 GHz dB typical 138 dBm 2 5 GHz to 3 GHz 123 dBm Level Display Range Log Scale 1 dB to 200 dB Linear Scale 0 to Reference Level Number of D...

Page 247: ...ier off 10 dB RF attenuation input signal 10 dBm 20 to 30 0 4 dB RBW Switching Uncertainty Uncertainty 100 Hz to 1 MHz relative to 1 kHz RBW 0 1 dB Reference Level Range 100 dBm to 30 dBm in 1 dB step...

Page 248: ...Image Frequency 60 dBc Intermediate Frequency 60 dBc Spurious Response 85 dBm typical System related Sideband Referenced to local oscillators referenced to A D conversion referenced to subharmonic of...

Page 249: ...z settable Output Level 20 dBm to 0 dBm in 1 dB steps Output Flatness 10 MHz to 3 GHz referenced to 50 MHz 3 dB 6 1 6 Input Output RF Input Impedance 50 nominal Connector N type female TG Out Impedanc...

Page 250: ...ation 6 8 User s Guide for DSA1000 Series USB USB Host Connector A plug Protocol Version 2 0 USB Device Connector B plug Protocol Version 2 0 VGA Connector VGA compatible 15 pin mini D SUB Resolution...

Page 251: ...ith option USB GPIB IEEE 488 2 Mass Memory Mass Memory Flash Disk internal USB Storage Device not supplied Data Storage Space Flash Disk internal 1G Bytes Power Supply Input Voltage Range AC 100 V to...

Page 252: ...0 User s Guide for DSA1000 Series Dimensions W x H x D 399 mm x 223 mm x 159 mm 15 7 inches x 8 78 inches x 6 26 inches approximate Weight Without battery 6 2 kg 13 7 lbs approximate With battery 7 4...

Page 253: ...ntation of the front panel keys and associated menu keys Refer to Front Panel Key Reference for key function descriptions Subjects in this chapter AMPT BW Demod Detector Display FREQ Marker Marker Fct...

Page 254: ...mV Volts Watts 1 1 Select Cable Off Antenna Other User 1 1 Amplitude RF Preamp On Off Ref Offset 0 00 dB Auto Range Corrections MaxMixL 10 00 dBm Input 50 O 75 O 2 2 Corrections Edit Select Off Correc...

Page 255: ...Menu Map RIGOL User s Guide for DSA1000 Series 7 3 7 2 BW BW BW V R Ratio 1 000000 RBW 1 000000 MHz Auto Manual VBW 1 000000 MHz Auto Manual Filter Type Gauss EMI 1 1...

Page 256: ...RIGOL Menu Map 7 4 User s Guide for DSA1000 Series 7 3 Demod Demod Demod Demod Off Demod Setup 1 1 Demod FM Off AM 1 1 AM FM Demod Time 100 000 ms Speaker On Off Volume 100 1 1...

Page 257: ...Menu Map RIGOL User s Guide for DSA1000 Series 7 5 7 4 Detector Detector Det Sample Pos Peak Neg Peak Normal RMS Avg Voltage Avg Quasi Peak 1 1...

Page 258: ...Hold Infinite Display Line 0 00 dBm On Off Active Fctn Top Graticule 5 Scr Saver Off Scr State On Off Brightness 5 1 2 Active Fctn Bottom Top Center 1 1 Menu Hold 10s 3s 5s 20s Infinite 1 1 Display S...

Page 259: ...A1000 Series 7 7 7 6 FREQ FREQ Frequency Stop Freq 3 0000000 GHz Center Freq 1 5000000 GHz Start Freq 0 Hz Freq Offset 0 Hz CF Step 300 00000 MHz Auto Manual Signal Track Peak CF 1 2 Signal Track Stat...

Page 260: ...s 7 7 Marker Marker Marker Delta Select Mkr 1 2 3 4 Normal Delta Pair Ref Delta Span Pair Span center Off Mkr Trace Auto 1 2 Mkr Trace 3 1 2 Math Auto 1 1 Marker All Off Readout Frequency Mkr Table On...

Page 261: ...OL User s Guide for DSA1000 Series 7 9 7 8 Marker Fctn Marker Fctn Marker Fctn N dB BW 3 00 dB Select Mkr 1 2 3 4 Noise Mkr Function Off Freq Count 1 1 Freq Count State On Off Resolution 1 000 kHz Aut...

Page 262: ...RIGOL Menu Map 7 10 User s Guide for DSA1000 Series 7 9 Marker Marker Marker Mkr Start Mkr CF Mkr Step Mkr Stop Mkr Ref Mkr CF Mkr Span 1 1...

Page 263: ...DSA1000 Series 7 11 7 10 Meas Meas Measure Pause Meas Ftcn Off Restart Resume Meas Mode Single Cont 1 1 Meas Fctn ACP Off T Power Chan Pwr OBW EBW C N Ratio 1 2 Meas Fctn Pass Fail Harmo Dist TOI 2 2...

Page 264: ...s Guide for DSA1000 Series 7 11 Meas Setup 7 11 1 T Power T Power T Power TP Type Peak Avg Num 10 On Off Avg Mode Exp Repeat Start Line 0 us Stop Line 100 us 1 1 TP Type RMS Peak Average 1 1 Note onl...

Page 265: ...ACP ACP ACP Main CH BW 2 000000 MHz Avg Num 10 On Off Avg Mode Exp Repeat Adj CH BW 2 000000 MHz CH Spacing 2 000000 MHz 1 1 7 11 3 Channel Power Channel Power Chan Power Integ BW 2 000000 MHz Avg Num...

Page 266: ...000 Series 7 11 4 OBW OBW OBW Max Hold On Off Avg Num 10 On Off Avg Mode Exp Repeat OBW Span 2 000000 MHz Power Ratio 99 00 1 1 7 11 5 EBW EBW EBW Max Hold On Off Avg Num 10 On Off Avg Mode Exp Repeat...

Page 267: ...C R Ratio C N Ratio Offset Freq 2 000000 MHz Avg Num 10 On Off Avg Mode Exp Repeat Niose BW 2 000000 MHz Carrier BW 2 000000 MHz 1 1 7 11 7 Harmonics Dist Harmonics Dist Harmo Dist NO of Harmo 10 Avg...

Page 268: ...000 MHz Avg Num 10 On Off Avg Mode Exp Repeat 1 1 7 11 9 Pass Fail Pass Fail Pass Fail Edit Limit Upper Lower Test On Off X Axis Freq Time Freq Interp Log Lin Del Limit Fail Stop On Off 1 1 Edit X Axi...

Page 269: ...ak Left Next Peak Peak Right Min Search Peak Peak Cont Peak On Off Search Para 1 2 Search Para Peak Search Max Param Pk Excursn 10 00 dB Pk Thresh 90 00 dB 1 1 Peak Peak Table 2 2 Peak Table Pk Readou...

Page 270: ...cel Print Resume Orientation Portr Landsc Page Size Default Inverted On Off Palette Gray Color 1 2 Print Qualities Default Copies 1 Date Prints On Off FileTypes Default 2 2 Page Size A5 Default A4 A6...

Page 271: ...Menu Map RIGOL User s Guide for DSA1000 Series 7 19 7 14 SPAN SPAN Span Zero Span Span 3 0000000 GHz Full Span Zoom In Zoom Out Last Span 1 1...

Page 272: ...ename Copy Create Dir Disk Mgr Name Prefix 2 3 Save Rename Create Dir Page Up Input Style EN CH Select Page Down Delete Save Cancel 1 1 Peak Table Limit 2 2 Storage File Type T3 T1 T2 Trace Math Trace...

Page 273: ...Menu Map RIGOL User s Guide for DSA1000 Series 7 21 7 16 Sweep Sweep Sweep Mode Single Cont Time 100 000 ms Auto Manual Auto SWT Normal Accy Numbers 1 Points 601 1 1...

Page 274: ...Guide for DSA1000 Series 7 17 System System System Calibrate Language Chinese Reset I O Setting Ref Sourse Int Ext Probe Power On Off Front Switch On Off 1 2 System Status Coupl Param Information Self...

Page 275: ...Guide for DSA1000 Series 7 23 Language Language English Chinese 1 1 Pwr On Preset Calibrate Self Cal On Off Cal Now 1 1 Reset Save Preset Power On Last Preset Preset Type Factory 1 1 Preset Type Facto...

Page 276: ...Remote I O Off LAN GPIB 18 1 1 Remote I O USB Off LAN GPIB 1 1 LAN Auto IP On Off Reset DHCP On Off Manual IP On Off IP DNS 1 1 Reset OK Cancel 1 1 Dev Class TMC Dev Addr 1 1 1 I O Setting USB Printer...

Page 277: ...Date Set Date 20000101 Time Date On Off Set Time 000000 1 1 TG Analyzer Power Demod Corrections 1 1 Information Status Screen Test Key Test 1 1 Self Test License Active 1 1 License Page UP Input Styl...

Page 278: ...8 Source For DSA1030 TG Source TG Lvl Offset 0 00 dB TG On Off TG Level 0 00 dBm Power Sweep On Off Power Range 0 00 dB Freq Offset 0Hz Normalize 1 1 Normalize Norm Ref Lvl 0 00 dB Stor Ref Normalize...

Page 279: ...100 Select Trace 1 2 3 Trace Type Clear Write Trace Math Blank All AVG Reset 1 1 Trace Type Min Hold Clear Write Max Hold Video Avg Power Avg Freeze Blank 1 1 Trace B T1 T2 T3 Function A B A T1 T2 T3...

Page 280: ...Menu Map 7 28 User s Guide for DSA1000 Series 7 20 Trig Trig Trig Trig Type Free Run Trig Setup 1 1 Trig Type External Free Run Video 1 1 External Edge Positive Negative 1 1 Video Trig Level 0 00 dBm...

Page 281: ...er applicable to DSA1030 and DSA1030 TG PA DSA1030 Advanced Measurement Module applicable to DSA1030 and DSA1030 TG AMK DSA1000 DSA PC Software Ultra Spectrum Optional Accessories Include N SMA Cable...

Page 282: ...WR Bridge 1 MHz to 2 GHz VB1020 VSWR Bridge 800 MHz to 4 GHz VB1040 Rack Mount Kit RM DSA1000 Soft Carrying Bag BAG DSA1000 USB to GPIB Interface Converter USB GPIB 11 1 V 147 Wh Lithium Battery BAT C...

Page 283: ...placement or repair of products which are approved defective To get repair service please contact with your nearest RIGOL sales and service office RIGOL does not provide any other warranty items excep...

Page 284: ...o clean the exterior surface perform the following steps 1 Disconnect the instrument from all power sources 2 Clean the loose dust on the outside of the instrument with a lint free cloth with a mild d...

Page 285: ...2 37 Coliapse Dir 2 112 Cont Peak 2 88 Corr Table 2 19 Corr View 2 19 Correction 2 18 Corrections 2 98 Coupl Param 2 96 DANL IX Del Limit 2 75 Delta 2 78 Delta Pair 2 79 Demod 2 41 2 98 Demod Time 2...

Page 286: ...Pos 2 46 Normal 2 34 2 78 Normalize 2 46 OBW 2 49 Offset Freq 2 67 Pass Fail 2 50 Peak CF 2 7 Peak Left 2 88 Peak Peak 2 88 Peak Right 2 88 Peak Search 2 90 Peak Sort 2 90 Peak Table 2 90 Phase Noise...

Page 287: ...2 53 Stor Ref 2 46 Sweep Mode 2 25 Sweep Numbers 2 25 Sweep Points 2 25 Sweep Time 2 70 System Information 2 97 System Message 2 97 Test 2 74 TG 2 97 TG level 2 43 TG Level Offset 2 43 Time 2 24 Time...

Reviews: