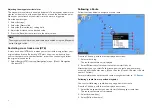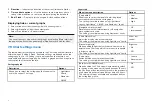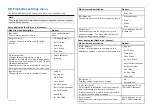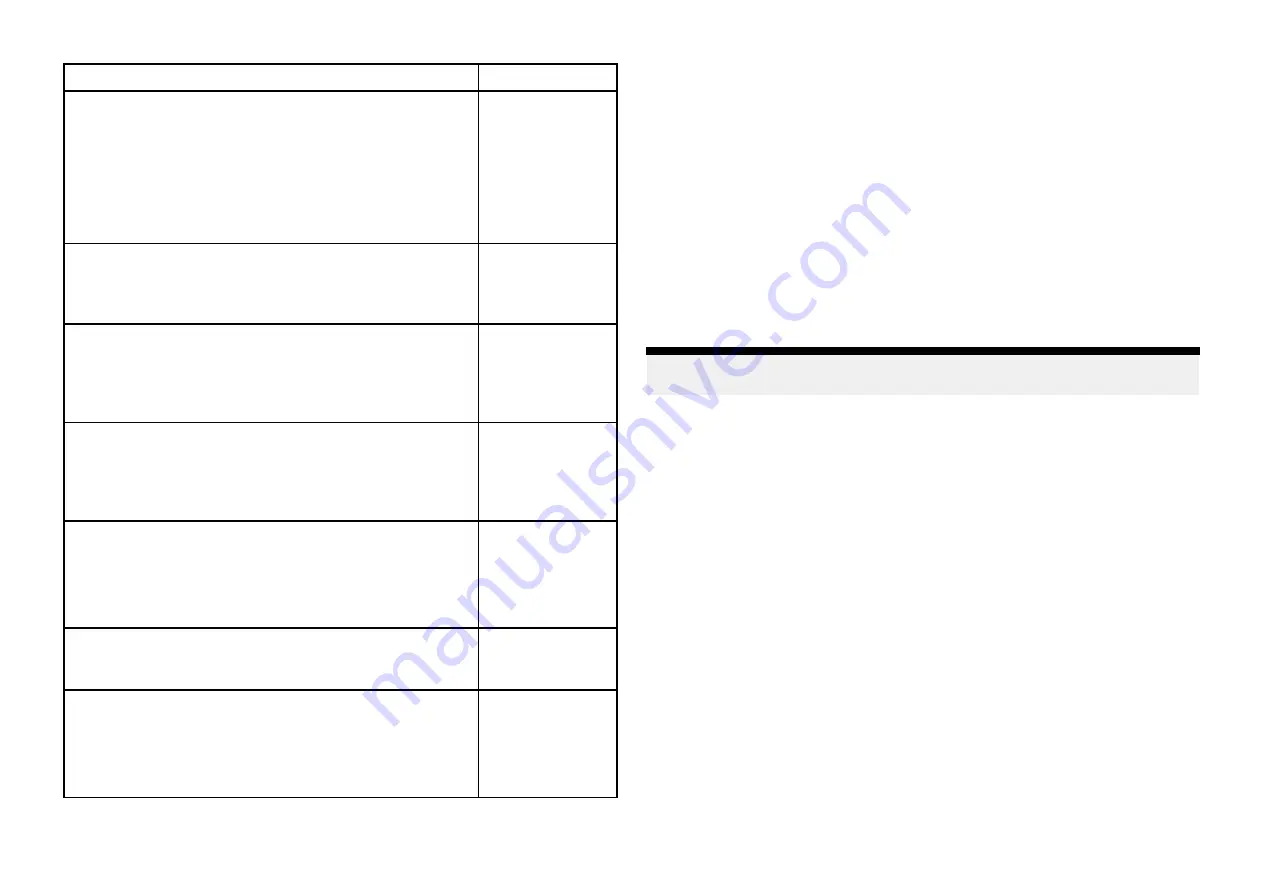
Menu item and description
Options
[Fishing Zone:]
You can set up a Fishing zone by enabling
[Fishing
zone]
and specifying a minimum depth and maximum
depth. Areas on the chart that are between these
depths will be colored White, areas outside of these
depths will be colored Blue.
This setting is available when using Navionics®
cartography.
• On
• Off
[Sonar logging]
Allows logging of depth and position data to your
Navionics chart card.
This setting is available when using Navionics® charts.
•
On
•
Off
[SonarChart Live]
Enables and disables Navionics SonarChart Live feature
which enables real time creation and display of high
resolution bathymetry charts.
This setting is available when using Navionics® charts.
•
On
•
Off
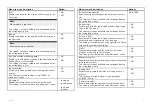
[Tide correction]
Enables Sonar logging depth measurements to be
offset by tide height data from nearby tide stations.
This setting is available when using Navionics®
cartography.
•
On
•
Off
[Density]
Selects the density of available depth contours.
This setting is available when using Navionics® charts.
•
Low
•
Medium
•
High
•
Very high
[2D shading]
Enables and disables 2D shading.
This setting is available when using Navionics® charts.
•
On
•
Off
[Density]
Determines the density of available depth contours.
This setting is available when using Navionics®charts.
•
Very high
•
High
•
Medium
•
Low
Databoxes tab
•
[1:]
— Determines the data item displayed in databox 1.
•
[2:]
— Determines the data item displayed in databox 2.
•
[3:]
— Determines the data item displayed in databox 3.
•
[4:]
— Determines the data item displayed in databox 4.
•
[Reset all]
— Selecting will reset all databoxes to factory defaults.
7.10 SonarChart™ Live
You can create personal bathymetry charts using your depth transducer and
the SonarChart™ Live feature, available with compatible Navionics® electronic
cartography cards.
Note:
Before using SonarChart™ Live ensure you have correctly configured
your transducer depth settings.
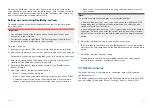
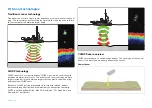
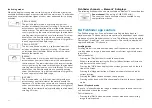
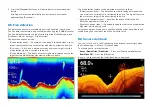
When using SonarChart™ Live, new contour lines are drawn in real time on
the screen based on your transducer’s depth readings. Color shading is used
to reflect depth, with dark red signifying the shallowest area. The sonar data
is recorded to your cartography card and is shared with Navionics when
you update your chart card online.
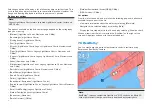
Tide correction
SonarChart™ Live records the actual readings from your depth transducer
under current tide / water level conditions. You can enable automatic
adjustment of depth readings based on normalized low tide / low water level
depth data taken from a nearby Tide station.
Enabling SonarChart Live
SonarChart™ Live enables creation of real time bathymetry contours.
With your transducer depth settings correctly configured and compatible
cartography selected:
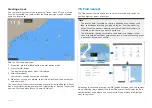
1. Select the
[Depths]
tab from the chart app settings menu:
[Chart app >
Menu > Settings > Depth]
.
2. Enable the
[Sonar logging]
toggle switch.
3. Select the
[SonarChart Live]
field and select
[On]
from the pop-over
options.
90


