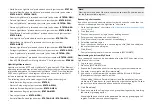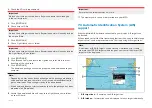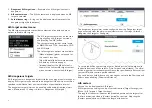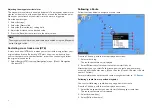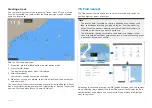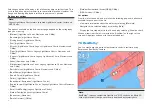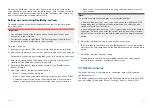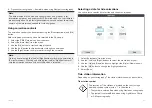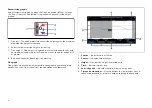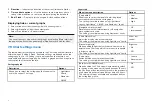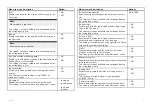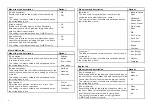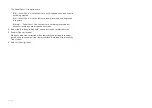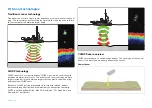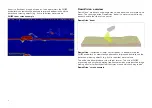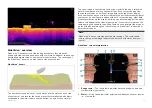
When using RealBathy™, new contour lines are drawn in real time on the
screen based on your transducer’s depth readings. Color shading is used to
reflect depth, with darkest shade signifying the shallowest area. The sonar
data is recorded to the inserted memory card.
Setting up and creating RealBathy contours
To enable creation of RealBathy™bathymetric contours in real time follow
the steps below:
Important:
• You will need to know the distance above the bottom face of your
transducer to the waterline.
• For tidal environments LightHouse™ NC2 cartography is required that
includes tide station information for your location.
From the Chart app.
1. Insert your LightHouse™ NC2 chart card into the display’s card reader.
2. Select your LightHouse™ chart card as your cartography for the Chart app.
For details on choosing your cartography refer to:
3. Enter the distance above the bottom face of your transducer to the
waterline in the
[Waterline to tdcr:]
setting field.
4. Enable the
[RealBathy;]
toggle switch, located in the
[Depths]
menu:
[Menu > Depths]
5. Select the relevant
[Height correction]
option:
•
[None]
— No corrections are made.
•
[Tidal]
— Uses nearby tide station data to correct height. When
[Tidal]
is selected a tidal station search is performed and a list of available
stations is displayed. Select the closest tide station to your location.
•
[Lake level]
— User specified value using the water level marker for
your location.
Note:
To ensure accurate contour depths it is recommended that:
• in tidal environments (e.g.: seas and oceans) you use LightHouse™ NC2
cartography that includes tide station information and select the tide
station closest to your location, or
• in fresh water environments (e.g.: lakes) select
[Lake level]
in the
[Height
correction:]
field and then enter the current reading from the water level
marker for your location into the field located under the height correction
option.
6. Adjust the
[Visibility:]
setting to the desired transparency.
100% provides full visibility of the RealBathy contours, as the percentage
decreases the chart detail behind the RealBathy contours becomes more
visible.
7. Select the required
[Density:]
setting.
Steep drop-offs can result in overlapping contour lines, lowering the
density in these situations provides a clearer view.
7.7 Reeds almanac
The Reeds almanac is available on for supported regions of Raymarine
LightHouse charts .
The Reeds symbols are displayed in the Chart app when the
[Streets & POI]
layer is enabled:
[Chart app > Menu > Settings > Layers > Street & POI]
.
81

