To enter the channel number or frequency directly, use the alphanumeric keypad.
After you have set the frequency in MHz, press
MENU/ENTER
. After you pressed this key,
the selected channel will be placed in the middle of the screen. You can set the position of
spectrum scan screen by
◄
and
►
keys after setting the
Center
value for
F2
key.
In addition to general parameters, you can also edit the following parameters to
adjust this mode settings:
1.
Hold level
. Showing of an additional trace with minimum or maximum level
on the screen.
Off
: No trace is shown;
Max
: Trace with maximum level is shown;
Min
: Trace with minimum level is shown.
2.
Span
. Setting of the frequency scanning range.
18/36/72
MHz
: Available values of the scanning range.
3.
Scan mode
. Selecting of the scanning mode.
Quick
: Quick scanning;
Precision
: Slow scanning that ensures maximum accuracy of the level
measurements;
Single
: Single scanning sweep. To start this sweep, press
AUX
key to open
the menu with additional set of functions, and then press
F2/Run
key.
If additional trace showing option is turned on (
Min
or
Max
values are selected for
Hold level
parameter), press
AUX
key to open the menu with additional set of functions,
and then press
F4/Reset
key.
4.3.4. Scan Measurement Mode
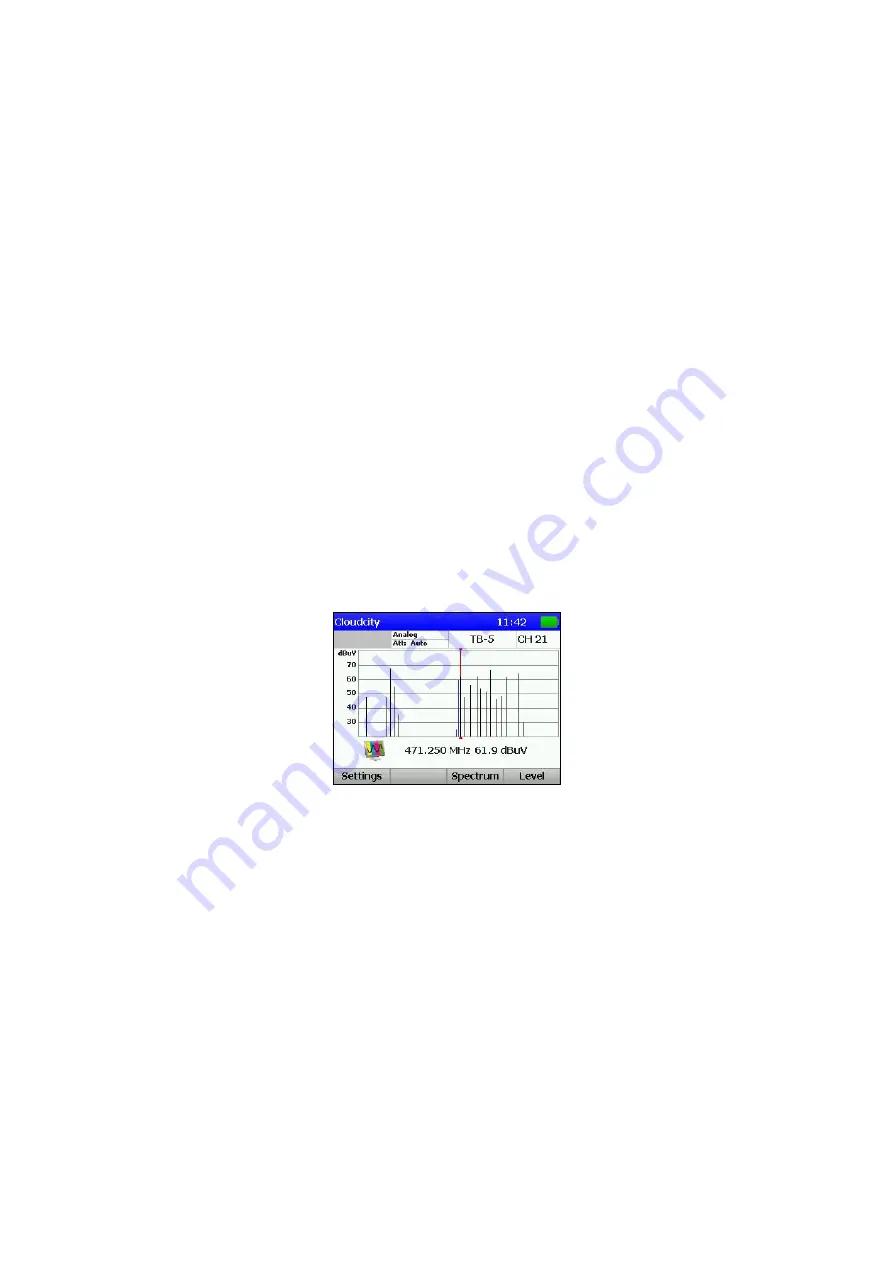
This mode displays the signal levels as a bar-graph. The screen view is presented in
figure 4.6:
Figure 4.6
The tuning frequency and the channel level value indicated by the marker are shown
under the level bar-graph. You can navigate the marker by means of
◄
and
►
keys. You
can set the marker position directly by entering the channel number using the
alphanumeric keypad. After you have entered the number, press
MENU/ENTER
.
In addition to general parameters, you can also set the following parameters to adjust
the mode configurations:
1.
Hist. type
. Selecting one of the
Scan
mode types.
2.
Scan:
Measuring of the channel level.
3.
Tilt:
Measuring of the tilt between the channels.
4.
Limit:
Measuring of the ripple of channel levels.
The screen view of
Tilt
mode is presented in figure 4.7.
15


