7.1.8. Temperature
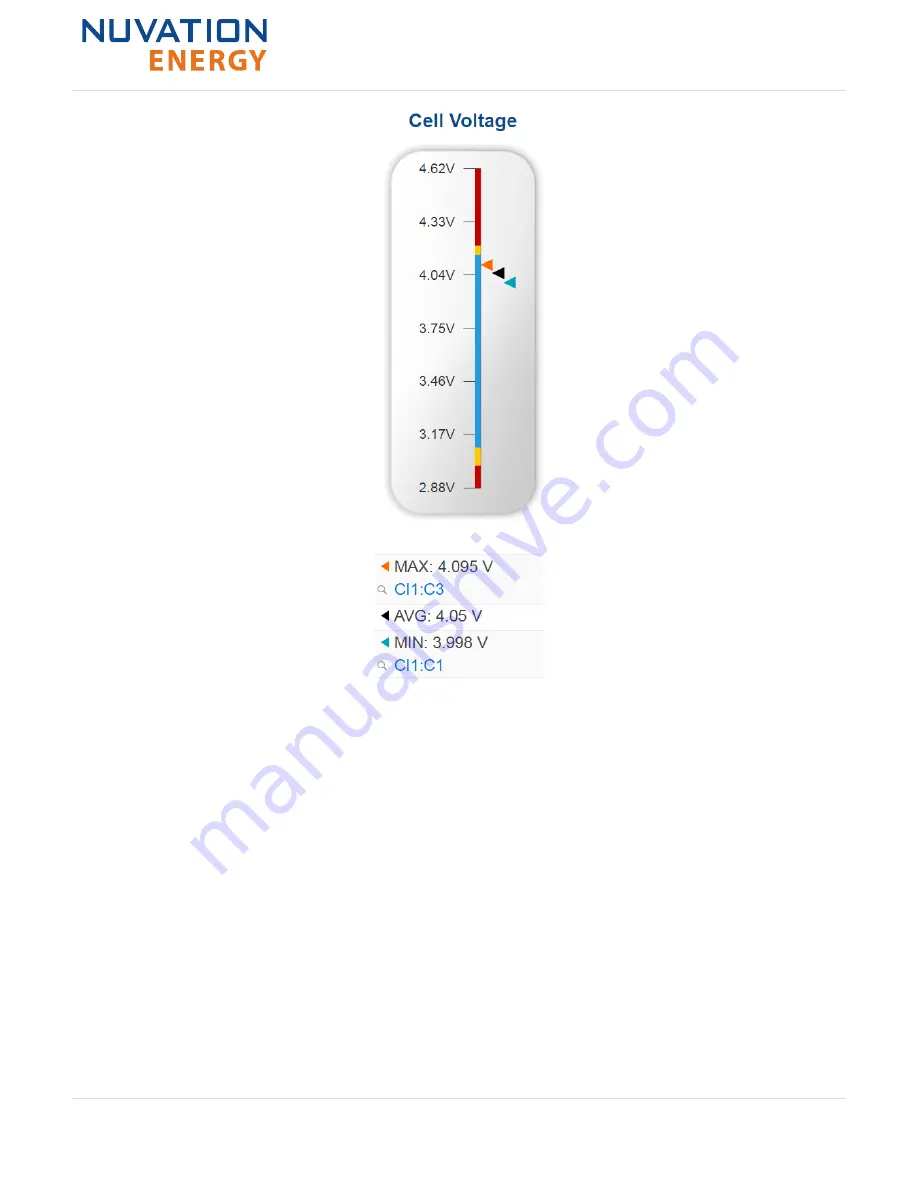
The temperature bar gauge shows the maximum, minimum and average cell temperature
measurements within the stack.
The high cell temperature and low cell temperature warning and fault threshold is visualized on the
gauge with yellow and red segments. The blue segment depicts the acceptable cell temperature
range.
If a triangle enters the yellow segment, a warning has occurred. If a triangle enters the red segment,
a fault has occurred.
The maximum and minimum cell location in the stack and their temperature value are shown below
the gauge, along with the average cell temperature value.
Nuvation Energy Stack Switchgear - Product Manual
Document ID: NE-PM-003
64
Rev 1.0, 2020-09-03


