


Java Device Manager
53
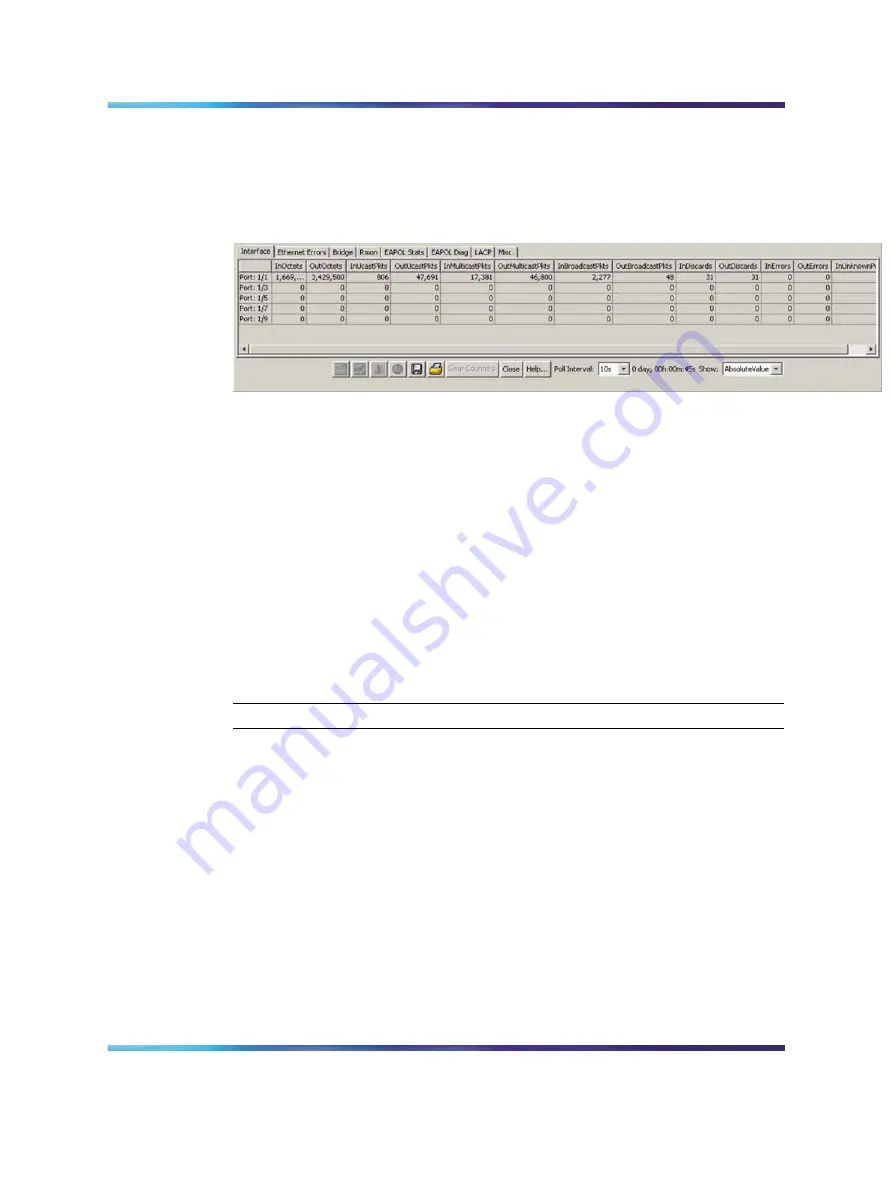
The statistics screen for multiple objects shows a single type of statistics
(
"Types of statistics" (page 50)
) for each selected object. For example,
"Interface statistics for multiple ports" (page 53)
shows AbsoluteValue
statistics for the selected ports.
Interface statistics for multiple ports
To change the type of statistics displayed, select a different type from the
show list at the bottom right of the screen.
The statistics are updated based on the poll interval shown at the bottom of
the dialog box. You can select a different polling interval.
Buttons for bar, pie, and line graphs are at the bottom of the statistics dialog
box.
You can export statistics to a tab-separated-format file and import the file
into other applications. To export the information, use the Export Data
button below the table.
Viewing statistics as graphs
To create a graph for an object:
Step
Action
1
Select the object or objects to be graphed.
2
Perform one of the following steps:
•
On the toolbar, click Graph Selected.
•
From the shortcut menu for the object, choose Graph.
•
Select the Graph > Chassis or Graph > Port.command
A statistics dialog box appears with tabs for categories of statistics
for the selected object (
"Statistics dialog box for a port" (page 54)
).
Nortel Ethernet Routing Switch 4500 Series
Overview — System Configuration
NN47205-500
02.01
Standard
5.0
23 February 2007
Copyright © 2007, Nortel Networks
Nortel Networks Confidential
.


