Configuring a FIX profile | 61
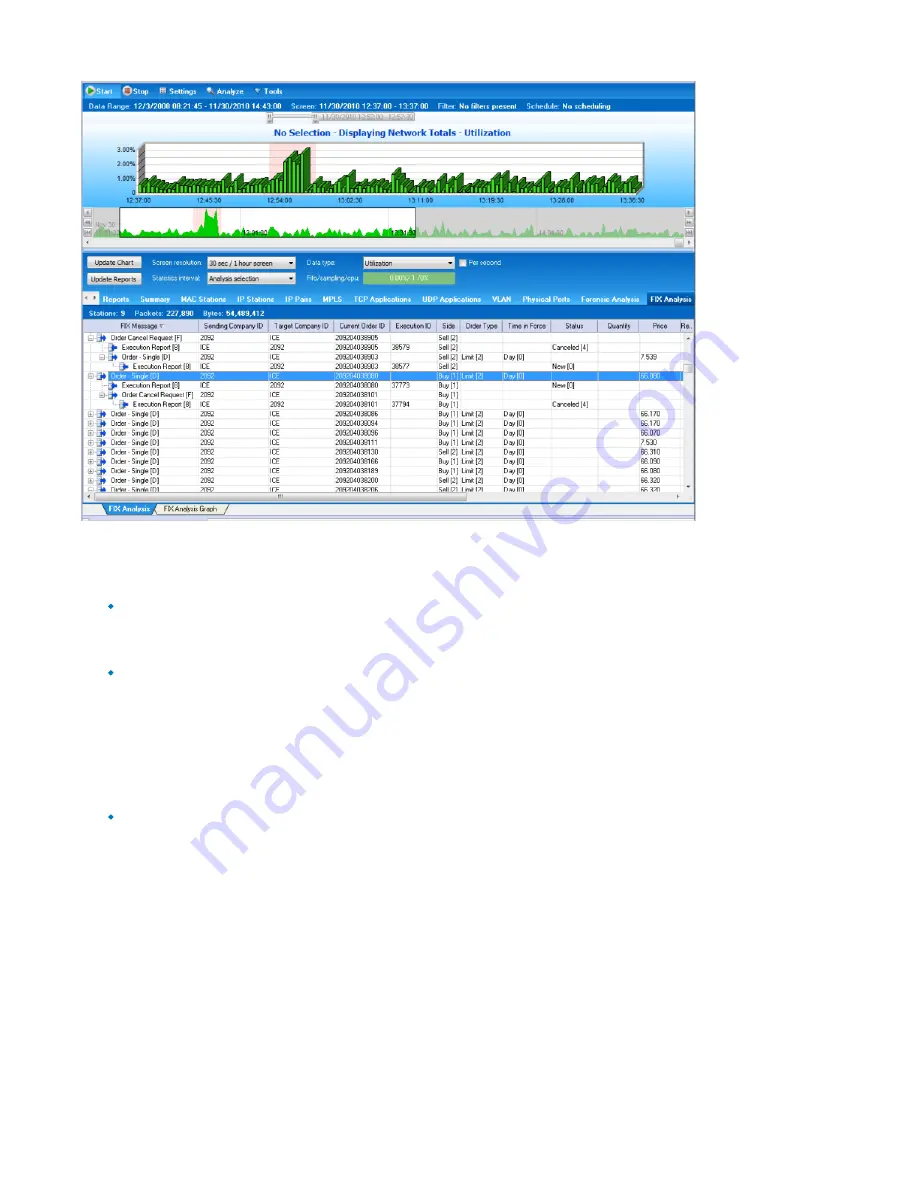
Figure 10: FIX Analysis
Outside of the GigaStor Control Panel, these other areas may be valuable for you when you are analyzing FIX
transactions:
Decode and Analysis in Observer—Allows you to decode and analyze the raw FIX information and
presents it in an easy to read format. In the Decode and Analysis tab you can use filters and do post-
capture analysis on specific FIX transactions that have issues.
Application Transaction Analysis in Observer—Examines all transactions related to FIX even those
beyond layer 4 into the application layer. Information about the transactions of applications for each
request and the type of request are tracked. View a graph of response time and application error
conditions or request and response results. ATA performs in-depth application analysis of each request
or type of request by examining important information within the payload. This information typically
involves massive amounts of data often best viewed in graphical format to more easily spot trends or
patterns.
Baseline and trending reports in Observer or Observer Reporting Server—Using Application Transaction
Analysis you can create reports on all FIX statistics for capacity planning. If you have numerous probes
from which you want FIX transactions aggregated and analyzed, then use Observer Reporting Server
(sold separately).
Configuring a FIX profile
Observer uses profiles to analyze FIX data. Default profiles are in three main categories: pre-trade, trade, and
post-trade. Within each category, there are numerous variants that allow you to focus on a specific trade type,
such as "Pre-trade: Quote Negotiation." You can use the settings described here to edit, create, import, or export
a FIX profile.
Table 6: FIX Settings


