Section 13- Cell Cultures
13. Cell Cultures
Using an absorbance spectrophotometer to monitor light scattered by non-absorbing suspended cells is common practice
in life science laboratories. Such applications, more than any other, accentuate the differences amongst the optical
systems of the numerous spectrophotometer designs.
Note: The most distinct difference between the NanoDrop
®
ND-1000 spectrophotometer “absorbance” values for microbial
cell cultures and those observed using classical cuvette based systems will be attributable to the shorter pathlength (1 mm
vs. 1 cm.) Values may not be exactly 10 fold different as readings are dependent on both the optics of a specific
spectrophotometer as well as the cell type in suspension.
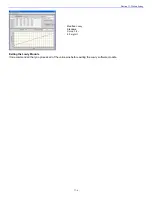
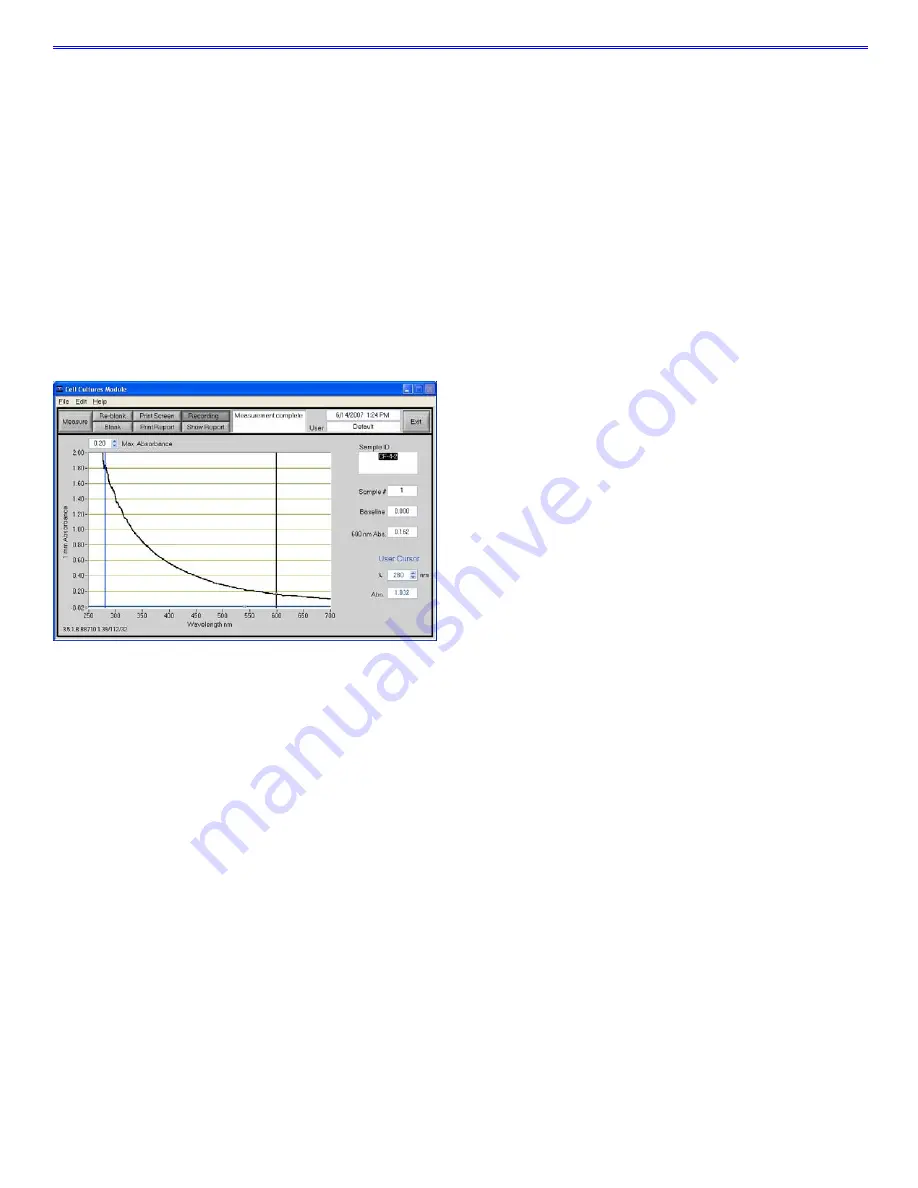
The ‘Cell Cultures’ module displays the sample spectrum from 250 nm to 700 nm. One cursor is fixed at the frequently
used wavelength for monitoring cell suspensions (600nm) while the second cursor can be set to the wavelength of
interest.
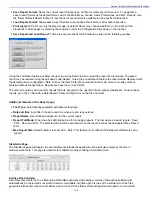
Unique Screen Features
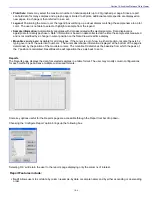
600nm Absorbance:
current value of the absorbance at 600 nm with the Baseline absorbance subtracted. Note: the
actual 1 mm absorbance is displayed.
λ
and Abs:
current value of the user-selectable wavelength cursor and corresponding absorbance. The wavelength can
be set by dragging the cursor, using the up/down arrows or typing in the desired wavelength.
Baseline:
the absorbance of the user selectable-baseline (horizontal) cursor. The user may drag this cursor to a new
vertical position to create a new baseline. The absorbance value of the baseline is subtracted from the absorbance of the
spectrum.
Max Absorbance:
used to rescale the upper limit of the vertical axis.
Sample Size Requirements
Field experience has indicated that 1ul samples are sufficient to ensure accurate and reproducible results when
measuring aqueous samples. However, if you are unsure about your sample composition or your pipettor accuracy, a 2 ul
sample is recommended to ensure that the liquid sample column is formed and the light path completely covered by
sample.
Cell Suspension Concentrations
Due to its shorter pathlength, the ND-1000 can measure absorbencies that are 10-fold higher than those measurable on a
standard cuvette spectrophotometer. This makes it possible to directly monitor concentrated cell suspensions. Since the
entire spectrum is displayed, diluted samples exhibiting very low ‘Absorbance’ at 600 nm can be monitored at lower
wavelengths, for example 280 nm.
13-1


