Section 14- Archived Data and Data Viewer
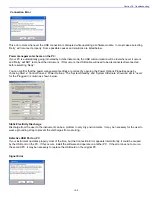
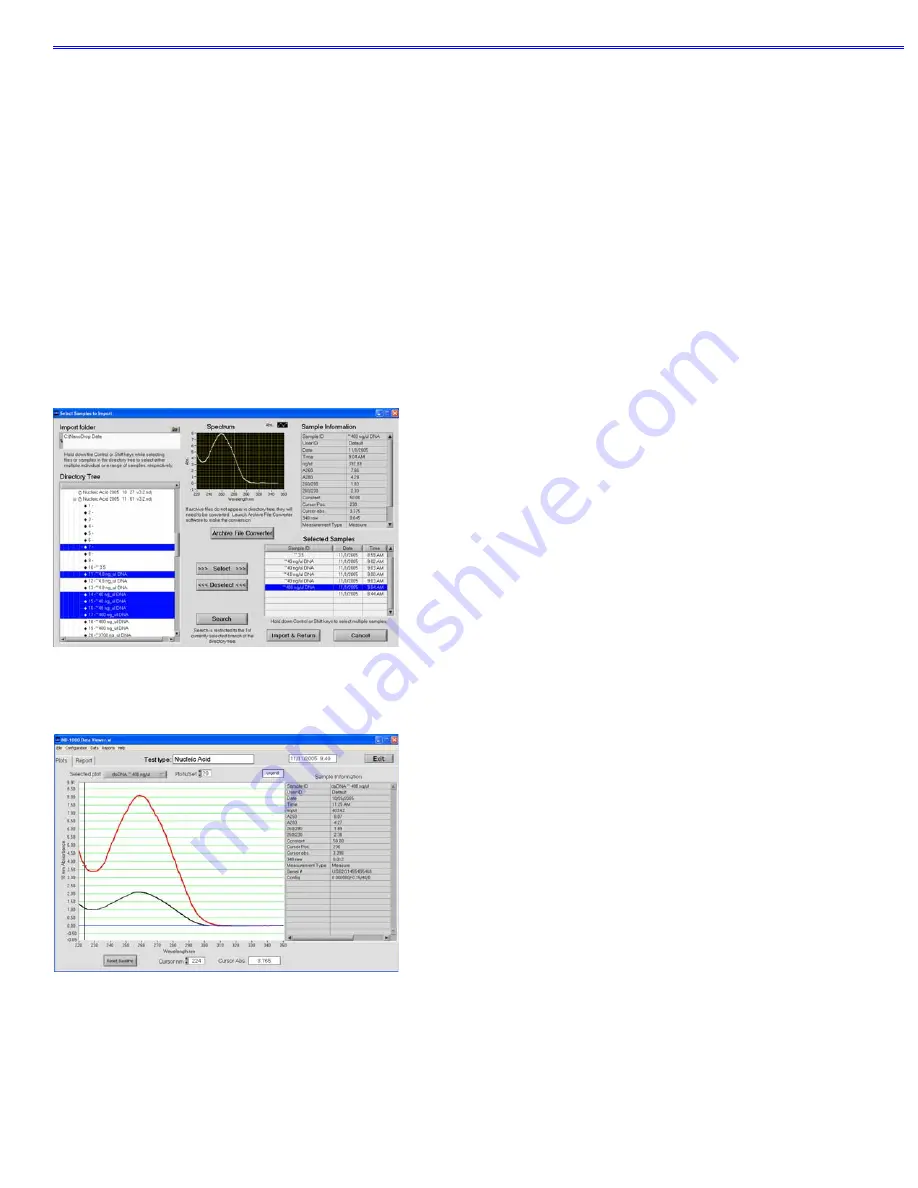
Directory tree
:
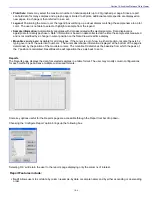
Used to select specific data to be imported. Clicking on the square to the left of each file name will
provide further detail to each level. Users may choose to select either individual samples within a file or the entire file.
All import selections must be of the same application or method type.
Note: Hi Abs data cannot be imported into the
Data Viewer but can be opened with Excel type spreadsheets.
Archive File Converter:
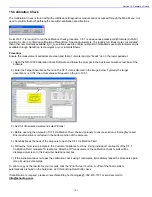
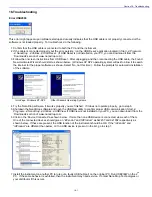
ND-1000 data generated with earlier versions of NanoDrop software and not stored in
c:\nanodrop data will need to be copied and converted to 3.2 version compatible .ndj files. Refer to the Archive File
Converter section below for more details. Note: The original archive files will not be altered during this process.
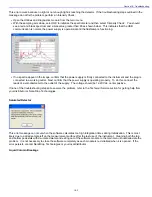
>>> or <<<:
Used to move the highlighted sample choices to or from the Selected Samples box. Note: The software
defaults to a buffer size of 200 samples.
Search
:
Function allows the user to locate specific data by searching through sample ID names.
Sample Information and Spectrum:
Populated with the information associated with the most recently highlighted
sample
.
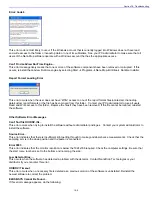
Import and Return:
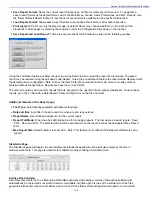
Uses selected sample data to populate Plots and Reports windows. Note: Holding down the shift
or control PC function keys will allow the user to select multiple samples and/or files for importing. The keys can also
be used to deselect multiple samples as seen in the following example:
Plots
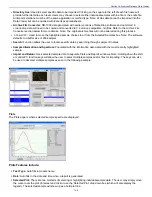
The Plots page is where selected sample spectra are displayed.
Plots Features include:
Test Type:
Auto fills in module name.
Date:
Auto fills in the date and time when a report is generated.
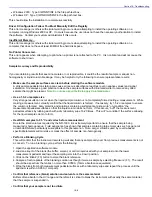
Selected Plot:
There are two methods of selecting or highlighting individual sample data. The user may simply move
the cursor over the plot of interest and click or use the ‘Selected Plot’ drop down box (which will also display the
legend). The selected sample will show up as a bold plot line.
14-3


