


Chapter 19
474
Running the debugger
After you write your code, you can start the JavaScript Debugger to check for
errors. The debugger checks for syntax errors first, then opens your page in the
browser so you can check for logical errors.
To start debugging:
1
Choose File > Debug in Browser, then select the browser from the list.
Alternatively, click the Preview/Debug in Browser button in the toolbar
(View > Toolbar) and select Debug in Internet Explorer or Debug in
Netscape Communicator.
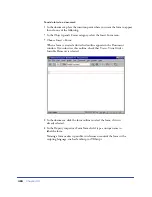
If the debugger finds syntax errors, it stops and lists them in the JavaScript
Syntax Errors window. See “Finding syntax errors” on page 475.
2
If you are using Netscape Navigator, click OK in the debugger warning box
that appears, then click Grant in the Java Security dialog box.
Note:
If you have already accepted a Macromedia Security Certificate, the Java
Security dialog box may not appear.
3
If you are using Internet Explorer (Windows only), click Yes in the Java
Security dialog box, then OK in the debugger warning box that appears.
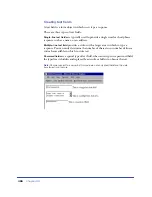
The debugger connects with the browser, but does not actually make a network
connection or connect to any Internet servers. The browser appears with the
JavaScript Debugger window, which is stopped automatically at the first line of code.
The JavaScript Debugger window appears with the browser window. The
debugger stops automatically at the first line of code.
To run the debugger:
Click the Run button in the JavaScript Debugger window.
To stop the debugger:
Click the Stop Debugging button in the JavaScript Debugger window. The
debugger will close.
Summary of Contents for 38028779 - Macromedia Dreamweaver - Mac
Page 1: ...macromedia Using Dreamweaver...
Page 148: ...Chapter 4 148...
Page 296: ...Chapter 12 296...
Page 472: ...Chapter 18 472...
Page 512: ...Chapter 21 512...
Page 562: ...Appendix 562...