41
3.
Press the ―
or
‖ button or rotate the knob, while observing changes in the TREND
diagram time and TREND curves;
4.
Stop at the period to be carefully observed; in case the vertical axis is out of proper size, for
example, some TREND values exceed the highest value of the current vertical axis, select
―Adjust amplitude‖ to adjust;
5.
If users want to know the measured value at certain time, just select ―move cursor‖ and move the
cursor to where they wants, then time will be displayed above the curve and measured values
below the curve;
6.
If users need output the TREND diagrams to the recorder, just select the ―record‖ button so as to
let the recorder output NIBP TREND of the current review window;
7.
Press ―
‖ to exit observation on TREND diagram.
7.2
TREND TABLE (TREND Figure)
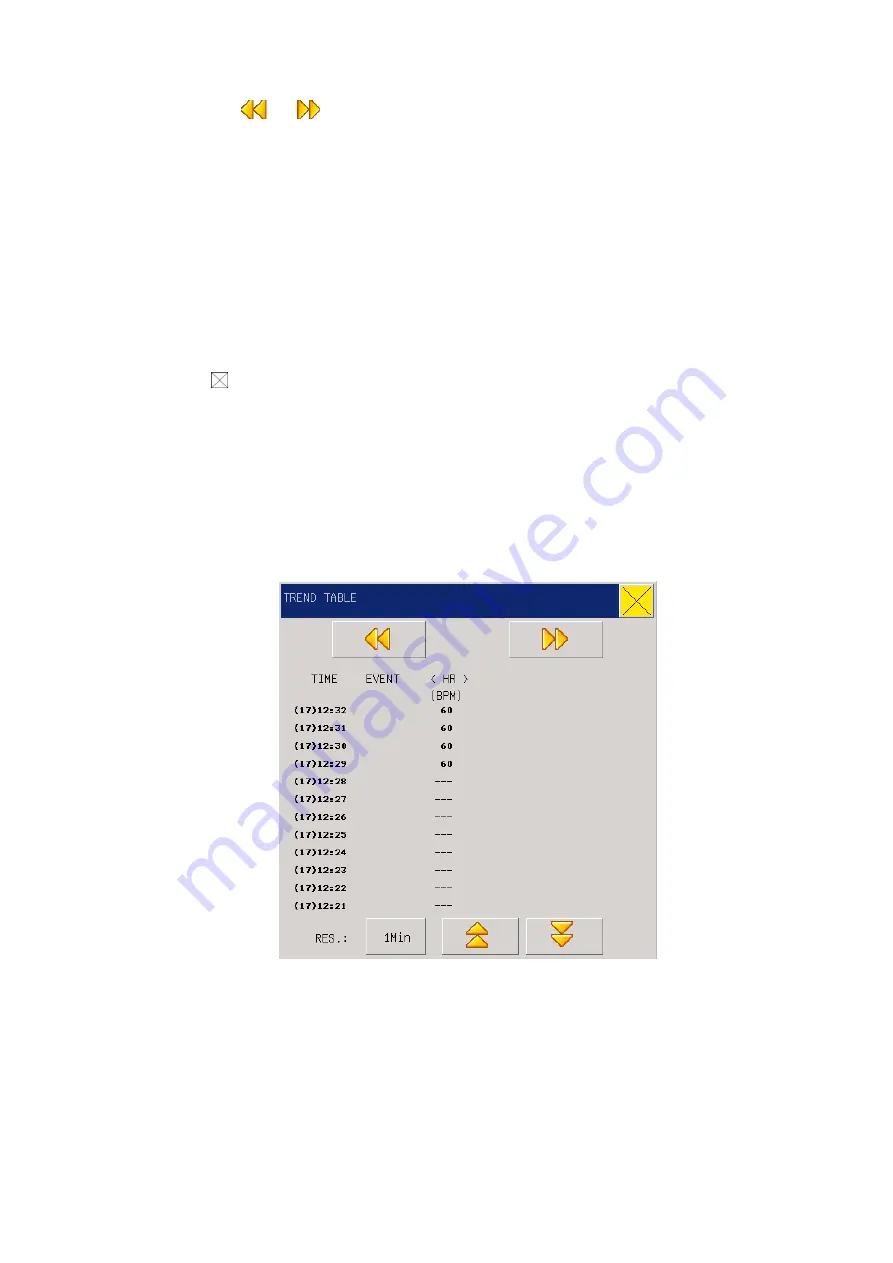
TREND Figure data over the previous 120 hours can be displayed in the following resolutions: 1 minute, 5
minutes, 10 minutes, 30 minutes and 60 minutes.
Select ―TREND TABLE‖ under the ―Main Menu‖ to pop up the following TREND figure:
Figure 7-2 Trend Table
Time corresponding to various groups of TREND data is displayed at the left column, with dates braced.
What are listed is the cases that have once been marked, which corresponds to the time of the marked cases.
Parameters in the TREND Figures can be categorized into the following 9 groups:
HR,


