The Point-to-Point Diagnostics Utility
Running Point-to-Point Diagnostics
5-6
WaveLAN/ISA Card User’s Guide
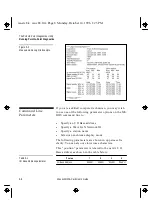
Figure 5-2
5
The Measurement Data Display
The Measurement
Data Display
5
The utility displays measurement data for both the local
and remote stations. For each station six measurements
are displayed:
●
Packets received - actual and expected.
●
Packets lost
●
Percentage successful packets received
●
Signal Level
●
Signal-to-Noise Ratio (SNR)
●
Signal Quality (SQ)
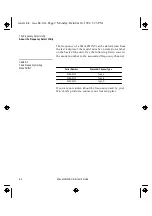
The Link Quality assessment is based on the Percentage
successful packets received, Signal Quality and SNR
measurements.
SNR
5
Signal-to-noise Ratio is based on the strength of the
received signal relative to the local noise. The received
Signal Level is displayed as well as the SNR
measurement.
isa-src.bk : isa-ch5.frm Page 6 Monday, October 14, 1996 1:23 PM


