²
0HDVXULQJ6NLOOV
67(3
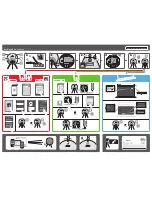
Note: The image displayed
shows the changes in the
sample event over time.
Statistical integrity is preserved
because the decay is
proportional to the persistence
population for each amplitude
or time combination in the data.
The brightness level of a single
color is used to denote signal
intensity. Particular populations
are given distinguishing shades
of color. These are dynamically
updated as data from new
acquisitions are accumulated.
Population distributions in rare
events can be highlighted by
additional saturation, as
illustrated in the screen at right.
Then turn the lower ‘menu’
to adjust the value of the
saturation to 10 %.
The screen will display:
Summary of Contents for Digital Oscilloscopes
Page 1: ...Hands On Guide to LeCroy Color Digital Oscilloscopes Revision C April 1998 ...
Page 21: ... ...
Page 36: ... HWWLQJ 6WDUWHG Now press the corresponding to select REDEFINE These menus will appear ...
Page 45: ... 0HDVXULQJ 6NLOOV 67 3 Press again The screen will then display ...
Page 49: ... 0HDVXULQJ 6NLOOV The screen will now display ...
Page 74: ... QDORJ 3HUVLVWHQFH The screen will then display 67 3 Press ...
Page 93: ... 0HDVXULQJ 6NLOOV ...
Page 127: ... 0HDVXULQJ 6NLOOV ...
Page 175: ... 0HDVXULQJ 6NLOOV ...
Page 177: ... 0HDVXULQJ 6NLOOV 67 3 Press again to display 67 3 Press and then ...