background image

²

$QDO\LVWRJUDPV

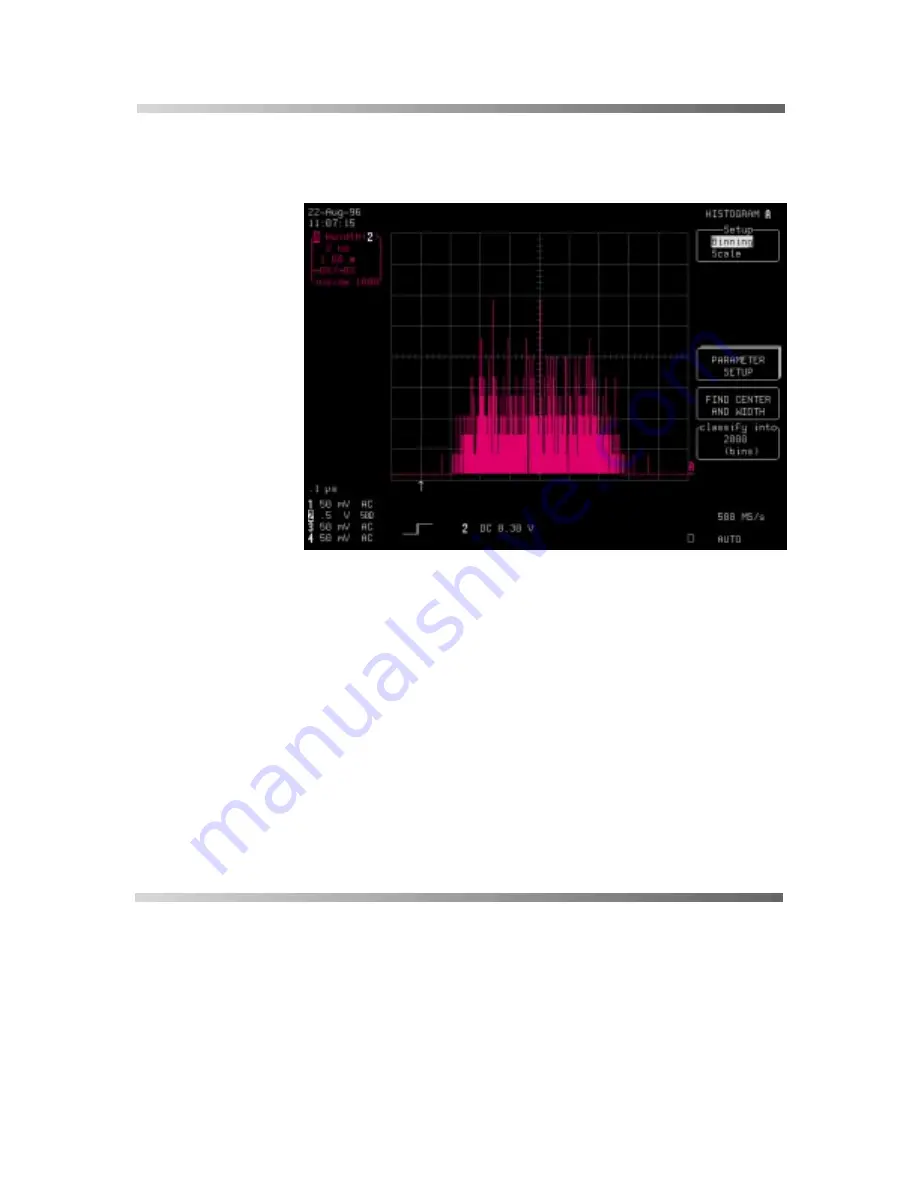
This screen shows the histogram after bin-number adjustment:

7LSV

: As many as two billion measurements can be included in

a parameter histogram display. This limit is set by pressing the
RETURN button in order to go back to the “

SETUP OF 

$

menus. The appropriate menu button or knob is then used to
set the required limit in the

 “using up to”

 menu (see screen

following 

Step 6

).

Summary of Contents for Digital Oscilloscopes

Page 1: ...Hands On Guide to LeCroy Color Digital Oscilloscopes Revision C April 1998 ...

Page 2: ...stered trademark of MATHSOFT Inc MATLAB is a registered trademark of The MathWorks Inc Microsoft MS and Microsoft Access are registered trademarks and Windows and NT trademarks of Microsoft Corporation PowerPC is a registered trademark of IBM Microelectronics DeskJet ThinkJet QuietJet LaserJet PaintJet HP 7470 and HP 7550 are registered trademarks of Hewlett Packard Company Manufactured under an I...

Page 3: ...ments 1 2 Bandwidth 1 3 Sample Rate 1 4 Memory Length 1 4 6LJQDO DSWXUH Acquisition Technique 1 5 Analog Digital Conversion 1 6 Number of Channels 1 6 Triggering 1 6 6LJQDO 9LHZLQJ 1 7 0HDVXULQJ Pulse Parameters 1 8 Waveform Math 1 8 6LJQDO QDO VLV Time Domain 1 9 Frequency Domain 1 9 Statistical Domain 1 9 RFXPHQWDWLRQ Removable Hard Disk Drive HDD 1 10 Interfaces 1 11 ...

Page 4: ...3DQHO RQWUROV 2 2 QVWDOODWLRQ KHFN 2 4 QLWLDOL DWLRQ 2 4 DYHIRUP FTXLVLWLRQ 2 7 TRACE ON OFF 2 8 TIMEBASE Controls 2 9 Vertical Controls 2 10 TRIGGER Controls 2 11 ZOOM 2 12 CURSORS MEASURE 2 14 Waveform Parameters 2 16 Summed Averaging 2 17 Fast Fourier Transform FFT 2 20 Waveform Storage 2 21 Save and Recall Setup 2 23 ...

Page 5: ... 16 Ensure accurate measurements 8VLQJ YHUDJH WR 5HPRYH 1RLVH 3 26 Reduce non systematic noise and improve the signal to noise ratio 9LHZLQJ ZLWK QDORJ 3HUVLVWHQFH 3 31 Explore the new dimensions Analog Persistence reveals RORUV WKDW LQN DQG LVWLQJXLVK 3 39 Color Association makes signal viewing clearer and easier XWWLQJ HDGWLPH HWZHHQ YHQWV 3 53 For a choice of single shot waveform segments witho...

Page 6: ...RUPV 3 114 Handle longer FFTs and multiple long waveform zoom math and storage 60 57 OLWFK DSWXULQJ 3 127 Find and capture glitches with the SMART Trigger DSWXULQJ 5DUH 3KHQRPHQD 3 135 Use the SMART Trigger to increase knowledge of rare waveforms 7ULJJHULQJ RQ RVW 6LJQDOV 3 144 Ideal for detecting interruptions in data streams 7UDQVIHUULQJ DWD WR 3 3 150 By GPIB floppy or RS232 communication port ...

Page 7: ... OO ERXW WKH 62 an overview of the principles of DSO operation including data sampling triggering recording how sampling rate affects usable bandwidth and how long memory improves sampling rate HWWLQJ 6WDUWHG shows you around the scope and step by step how to capture waveforms and perform basic measurements 0HDVXULQJ 6NLOOV a set of tutorials describing again step by step how to make the most usef...

Page 8: ...r you Part 1 maps the digital landscape and shows you where to find and mine its riches Basic concepts are explained and the main digital concepts and techniques outlined The advantages of your LeCroy scope are also covered Having completed Part 1 you ll then be ready to zoom in on your scope in Part 2 C A P T U RE VIE W AN A L Y Z E ...

Page 9: ... and general purposes And the sub 100 MHz low cost scopes are useful for work on low frequency signals DVLF OHPHQWV The way in which each element of the DSO works separately and in conjunction with the other elements Ø Amplifier amplifies the input signal so that it can be measured Ø Analog to Digital Converter ADC converts the analog signal into digital form by translating it into a series of sam...

Page 10: ...ned by the demands of your applications In assessing the overall signal representation quality of a digital oscilloscope particular consideration needs to be given to the cardinal parameters of bandwidth sample rate and acquisition memory length DQGZLGWK The bandwidth specification of a DSO indicates the ability of its front end amplifier to faithfully track an incoming signal The DSO s bandwidth ...

Page 11: ...the faster the possible sample rate for a given waveform duration The signal captured with a long memory DSO has a greater resolution while for short memory DSOs the high sample rates quoted are only available at a few fast time base settings Long memory DSOs allow operation at the highest possible sample rate and over a far greater number of timebase settings RZ UH 62V 8VHIXO DSWXUH DSWXUH DQG LV...

Page 12: ...the user The captured input data signal is transferred to memory for viewing measurement and analysis The DSO may also employ a technique called Random Interleaved Sampling RIS to increase its effective sampling rate in viewing repetitive signals LeCroy s high performance model has a maximum rate of 10 giga samples per second For slower timebases there exists Roll Mode where the signal being acqui...

Page 13: ...to small voltage changes And the greater its memory capacity the longer the recording time that will be available 1XPEHU RI KDQQHOV Your LeCroy DSO has four channels as well as an external trigger channel and a CAL BNC output connector The CAL BNC can be used as the source of a calibration signal an output pulse on the occurrence of each trigger or an output pulse signaling a Pass Fail condition 7...

Page 14: ...e signal and shows it on the screen Also displayed are internal status and measurement results as well as operational measurement and waveform analysis menus The LeCroy DSO s large screen and a waveform grid that fills the viewing area accelerate visual processing and facilitate more effective communication of on screen information Other advanced display techniques give major performance improveme...

Page 15: ... absolute or relative times and amplitudes However most users measure the same waveform parameters such as risetime falltime pulse width overshoot undershoot peak voltage peak to peak voltage maximum minimum standard deviation rms value frequency and period These and many other parameters are available using your LeCroy oscilloscope DYHIRUP 0DWK Waveform math allows the display of final answers ra...

Page 16: ...nsform converts sampled waveform information into a unique set of sine wave components The data is usually plotted as amplitude vs frequency exposing information not easily visible in the time domain amplitude vs time Ideally it can be used for such analyses as measuring frequency components of communication signals and monitoring drift in an oscillator The frequency resolution of an FFT is direct...

Page 17: ...igital data or hard copy records 5HPRYDEOH Files saved in the TIFF format can be imported into PCs and other computers The portable PC Card HDD Hard Disk Drive is a PCMCIA Type III device much faster than a floppy disk and with far greater capacity that can be popped in and out of your LeCroy DSO or computer There is an HDD adapter on the rear panel of your scope Note that test data can be process...

Page 18: ...s storage printing and transfer to memory devices the scope offers push button transfer of waveforms and settings to the LW series of arbitrary waveform generators This enables for example a reference waveform to be captured from a known good device and used as a test stimulus applied to other devices ...

Page 19: ...hat the instrument can do and start working with it quickly and effectively Following this you ll be ready to go on to Part 3 and to connect your own signals to the scope For complete details on all features of your LeCroy color digital oscilloscope see the accompanying 2SHUDWRU V 0DQXDO C A P T U RE VIE W AN A L Y Z E ...

Page 20: ...ntrols the OFFSET and the vertical sensitivity for input channels The VAR button also in this group of controls gives variable fully calibrated sensitivity throughout the scope s range 6 67 0 6 783 the dark gray menu entry buttons that dominate this group access the main on screen menus and the acquisition processing and display modes The two knobs adjust menu values and command cursors 0HQX XWWRQ...

Page 21: ... ...

Page 22: ... Before a display appears the instrument will perform hardware and software self tests followed by a full system calibration The front panel standby LED light located below the right hand corner of the screen will be illuminated during this sequence The full testing procedure will take approximately ten seconds after which the display will appear before powering up QLWLDOL DWLRQ To initialize the ...

Page 23: ...rols will apply to the function action or trace represented Each menu button in the column of buttons running down beside the screen corresponds to the menu immediately next to it The individual buttons illustrated three dimensionally in this drawing are those used for the actions described here Throughout the guide 3 D buttons and knobs that punctuate the text represent particular controls to be ...

Page 24: ...pe initialized we re ready to explore some of its basic functions XW ILUVW H QHHG D 6LJQDO Connect a BNC cable from the CAL output at right to the Channel 1 CH 1 BNC input at left We can now go on to acquire and display waveforms ...

Page 25: ...een will show a 1 kHz square wave Both Channel 1 the square wave and Channel 2 the horizontal line are displayed Channels time and volts per division are shown in the trace labels at top left of screen Note Auto Setup is a particularly useful feature that facilitates the display of a wide range of repetitive signals including those with duty cycles as small as 0 1 ...

Page 26: ...WDUWHG 75 21 2 To switch off a channel Channel 2 in this example Press the corresponding TRACE ON OFF button located on the CHANNELS control panel This action removes both the trace and its label from the screen ...

Page 27: ...base The selected time division setting is shown on the lower left hand side of the screen Now to capture the signal for a shorter period change the setting to 0 2 ms div But make sure to reset it to 0 5 ms div for the remainder of these exercises ...

Page 28: ...otations so that the entire signal reaches from top to bottom of the grid The volts div setting still shows in the trace label Filling the grid in this way ensures that the signal uses the full range of digitizing levels available 8 bits 256 levels for the best vertical resolution To return the vertical gain to its 1 2 5 sequence Press again The knob controls the vertical position of the acquired ...

Page 29: ... 100 pre trigger and from left to right hand edge of the grid This knob can also be used for setting the post trigger in seconds up to 10 000 divisions The trigger position is shown by at the bottom of the grid The knob adjusts the trigger s vertical threshold Arrows on either side of the grid indicate the threshold position arrows that are only visible if the trigger source is one of the traces o...

Page 30: ...ss Then press the corresponding to select XDO from the Grids menu Now two grids are shown on the screen giving optimum viewing of the expanded trace Note The Zoom function is an important benefit of the scope s acquisition memory It can also be considered as an additional timebase providing alternative sweep speeds ...

Page 31: ...unt of zoom Turn to move the expanded part of the upper trace Turn to expand vertically Note that the expanded part of the upper trace shows the section of the original waveform being viewed by the zoom Vertical and Horizontal settings for the zoomed waveform are shown in the trace label ...

Page 32: ... a cross hair on the waveform As the cursor moves its time value in relation to the trigger point shows at the base of the lower grid while indicated in the trace labels is its voltage amplitude value Note Use cursors to make fast accurate measurements and eliminate guesswork See the Operator s Manual and Accurate Measuring with Cursors in Part 3 of this guide for more about cursors ...

Page 33: ... Now two cursor menus are available operated by the upper and lower knobs respectively The Relative Time cursors appear as vertical arrows on the waveform Shown below the grid is the relative time difference between the cursors while the trace labels show the voltage amplitude difference ...

Page 34: ...voltage parameters Press the corresponding buttons to select from the mode menu 6WG 9ROWDJH and next 6WG 7LPH The list of voltage parameters on screen will be changed by these selections The parameters are computed each time the trace is updated Press the corresponding to select 2Q from the statistics menu You will now see the average lowest and highest values of each parameter and the standard de...

Page 35: ...and the ZOOM function Press to turn on Trace C and ZOOM on it Now press The menus shown here will appear Use the Summed Averaging function to improve the vertical resolution of repetitive signals or to average out unwanted noise on a live signal ...

Page 36: ... HWWLQJ 6WDUWHG Now press the corresponding to select REDEFINE These menus will appear ...

Page 37: ...ll change to display the menus shown here Now use the corresponding to select YHUDJH from the Math Type menu The scope may allow various types of averaging see Avg Type menu depending on its configuration Note the measurement resolution s increase compared with the live trace ...

Page 38: ... that would otherwise be impossible to detect on a time domain record Press the corresponding to select REDEFINE And then press those s that will make the selections highlighted on the screen below The lower trace will show the FFT transform of the square wave on Channel 1 Now you can use the absolute horizontal cursor to make a frequency measurement But first press ...

Page 39: ...mponents 3 kHz 5 kHz 7 kHz are the harmonics that contribute to building the square wave To return to normal operation Press the top to select 2II Now press to return to normal triggering DYHIRUP 6WRUDJH The scope has four waveform memories M1 M2 M3 and M4 In this example the waveform will be stored in M2 Press to turn off Trace C and FFT Now press Then press the respective s to select from the st...

Page 40: ... select 0 from the from Memory menu and DO RECALL 0 And press to turn off Trace A Note As many as four waveforms can be saved and stored until overwritten by other waves or the scope is switched off Trace A displays the waveform saved in M2 which can then be repositioned and expanded using the ZOOM controls ...

Page 41: ... Press the to select 5HFDOO for the original settings Finally press the for FROM SETUP 1 Note Entire panel setups such as those of often performed measurements can be saved and stored in non volatile internal memory for later recall Up to four setups can be stored thousands with the optional DOS compatible memory card floppy or removable hard disk ...

Page 42: ...s in Part 3 show you how to perform the most common types of measurements As in Part 2 the tutorials take a practical step by step approach to famliarizing you with the use of your LeCroy color digital oscilloscope C A P T U RE VIE W AN A L Y Z E ...

Page 43: ...for ZOOM MATH it reverts to its default power up settings with both Traces 1 and 2 activated The traces shown depend on the previous setup and are switched on or off using the corresponding TRACE ON OFF buttons When CH 1 is switched off Channel 2 alone will remain activated as shown here Connect the signal to be measured for example the calibrator CAL to the Channel 2 BNC input CH 2 Reset press th...

Page 44: ...nput to the oscilloscope COUPLING like most of the vertical controls applies only to the selected channel highlighted on screen Press Then press the corresponding to select from the Coupling menu the coupling matching the source s impedance 50 Ω in this case The screen will display ...

Page 45: ... 0HDVXULQJ 6NLOOV 67 3 Press again The screen will then display ...

Page 46: ... LUVW 6WHSV These three basic steps will be repeated as a prelude to performing most of the described measurements that follow ...

Page 47: ...zing the digitized signal covers all eight screen divisions without going off screen clipping Here s how best to digitize on all eight bits Connect the signal to be measured a 1 MHz 100 mV peak to peak triangle wave to CH 2 Reset press the top and simultaneously Then press to turn off Trace 1 Press then the corresponding to select from the Coupling menu the coupling matching the source s impedance...

Page 48: ...el input sensitivity and have the signal fill all eight divisions of the screen And to even more finely adjust the sensitivity press 7LSV Changing the sensitivity using the VAR button will give a non rounded gain for example 12 8 mV DIV Determining the amplitude of the signal by reading visually from the screen can be difficult To avoid reading errors use CURSORS see Accurate Measuring with Cursor...

Page 49: ... 0HDVXULQJ 6NLOOV The screen will now display ...

Page 50: ... Voltage and Time parameters as well as parameter customization This tutorial shows how standard parameters are displayed to characterize pulses vertically and horizontally Automatic parameter measurement and statistical values thus become easily obtainable SSOLFDWLRQ 6HWXS Connect the signal to be measured for example the CAL signal with the shape selected as pulse 25 ns to CH 1 ...

Page 51: ...7 3 67 3 Reset press the top and simultaneously Then press to turn off Trace 2 Press then the corresponding to select from the Coupling menu the coupling matching the source s impedance 50 Ω Press again The screen will display ...

Page 52: ... 3XOVH KDUDFWHUL DWLRQ 67 3 67 3 Press Then press to select 3DUDPHWHUV The screen will display 67 3 Next press ...

Page 53: ... by the number of points DPSO the amplitude with noise and overshoot resistant estimator amplitude top base 67 3 Now press to select 6WG 7LPH from the mode menu The five main horizontal parameters of the last pulse displayed beneath the grid next screen SHULRG the duration of a full cycle at 50 crossings ZLGWK of the first 50 pulses or in the analyzed region ULVH the transition time on the rising ...

Page 54: ... period Therefore the period parameter is not calculated and no value is displayed 7LSV In order to perform the parameter calculation on a particular section of the signal adjust the left and right cursors using the upper and lower knobs respectively on the SYSTEM SETUP part of the front panel ...

Page 55: ...3 Use the sto reselect the entire trace as the area of interest as described in the 7LS on the previous page Then press the corresponding menu to select 2Q from the statistics menu Four different values are displayed for each parameter average value lowest value highest value and sigma the standard deviation of the data values from the mean value In order be sure of the statistics obtained you wil...

Page 56: ...R SWEEPS button Only the future acquisitions will be included in the calculation All these parameters are readable from a PC linked to the scope by GPIB or RS232 remote control using the PArameter_VAlue query Also possible using Custom Mode is the selection of five different parameters even more with the WP03 package relating to a variety of traces or memories between the available standard parame...

Page 57: ...e of a signal And Time Frequency cursors are markers moved along the waveform that can be placed at a desired time to read the signal s amplitude at that time For details of cursor behavior in the different cursor and display modes see the 2SHUDWRU V 0DQXDO SSOLFDWLRQ 6HWXS Connect the signal to be measured for example the calibrator CAL to CH 1 67 3 Reset press the top and simultaneously Then pre...

Page 58: ...oupling menu the coupling matching the source s impedance 50 Ω Press again Turn to adjust the timebase to fill the screen with the signal Press to halt the scope and display Note Pressing SINGLE is a smooth way of stopping the scope to allow measurement of the waveform captured on screen ...

Page 59: ...rsor to the top of the signal Note In Absolute Amplitude Mode selected here by default a single cursor bar in the form of a broken line is displayed in this example shown placed at the very bottom of the grid The vertical position of this bar on the grid can be adjusted by turning the corresponding cursor knob The difference in amplitude between the cursor and the ground level indicated by the 1 a...

Page 60: ...p and down the grid Here the difference in amplitude between the ground and maximum levels of the square wave has been measured and is shown in the trace label 67 3 Press the corresponding to select 5HODWLYH from the type menu This will activate the Relative Amplitude Mode and display a pair of cursors ...

Page 61: ... the difference between the two in this case giving the wave s amplitude indicated in the trace label 67 3 7LSV Press the corresponding menu button to select Track 2Q from the Reference cursor menu Now when the reference cursor bar is moved using the upper knob the difference bar will track it and the two lines will move in tandem remaining the same distance apart However turning the lower Differe...

Page 62: ...al arrow on the grid base When the markers are placed on a data point they change appearance see the Operator s Manual for a full description The Absolute Time cursor is a cross hair marker Here the cursor highlighted to make it more visible in this example is shown at the trigger point on the rising edge of the square wave 67 3 Turn the corresponding to the cursor Position menu to change the posi...

Page 63: ...he trigger point and the Absolute Time cursor is shown as the Time value directly beneath the grid The highlighted cursor in this example has been moved to the falling edge of the square wave 67 3 Press the to select 5HODWLYH from the type menu and activate Relative Time Mode ...

Page 64: ...wnward pointing arrows are shown highlighted together at the rising edge of the square wave Using the knob corresponding to its menu either cursor can be moved independently of the other to any point on the trace The value representing the time difference between the two will appear below the grid while the amplitude difference appears in the trace label The screen will display ...

Page 65: ...d to the falling edge of the square wave while the Difference cursor has been placed at the maximum level Displayed in the trace label when LII 5HI is selected is the gain by division and difference in amplitude between the two cursors On the next screen the Relative Time cursors have been moved to illustrate how they work 7LSV To display in the trace label each cursor s absolute amplitude relativ...

Page 66: ... In this tutorial s final screen LII 5HI has been selected displaying the amplitude values for each cursor Note The absolute amplitude values of the Reference and Difference cursors are shown in the trace label respectively ...

Page 67: ...prove the signal to noise ratio Here s how SSOLFDWLRQ 6HWXS Connect the signal to be measured a 33 kHz 1 0 V peak to peak square wave with noise to CH 2 67 3 67 3 67 3 Reset press the top and simultaneously Then press to turn off Trace 1 Press then the corresponding to select from the Coupling menu the coupling matching the source s impedance 50 Ω Press again ...

Page 68: ... 5HPRYLQJ 1RLVH ZLWK YHUDJH The screen will display 67 3 67 3 Press Press the corresponding menu to select XDO from the Grids menu ...

Page 69: ... 0HDVXULQJ 6NLOOV The screen will now display 67 3 67 3 67 3 Press Press the corresponding menu to select REDEFINE Press the corresponding menu to select HV from the use Math menu ...

Page 70: ...ter importance in the average calculation ratio defined by the user The desired number of sweeps acquisitions taken into account in the averaging can also be selected using the corresponding menu button Here an average of 1000 acquisitions is selected from the for menu Any trace can be averaged CH 1 CH 2 CH 3 or CH 4 Trace A B C or D or Memory 1 2 3 or 4 Press the corresponding menu to select YHUD...

Page 71: ...e 1000 acquisition averaged result on Trace A Note With Trace A on the sweep counter in the Trace A label at mid left of screen will mount until the number of sweeps reaches that selected In the meantime the intermediate result of the average is displayed 216 swps as shown on the previous page Once the selected sweeps number is reached calculation stops and the final result of the average is displ...

Page 72: ...ng the most frequent signal path three dimensionally Here s how to use this unique feature to reveal the AM modulation of a sinewave SSOLFDWLRQ 6HWXS Connect signal to be measured an AM modulation of a 2 MHz sinewave with 100 kHz squarewave to CH 2 67 3 67 3 67 3 Reset press the top and simultaneously Then press to turn off Trace 1 Press then the corresponding to select from the Coupling menu the ...

Page 73: ... stable trigger However in the final periods the signal shows a number of jumps Without LeCroy s unique Analog Persistence feature it s not easy to characterize these modulation variations in the normal display mode 67 3 The screen will display Now press ...

Page 74: ... QDORJ 3HUVLVWHQFH The screen will then display 67 3 Press ...

Page 75: ... different states The number of acquisitions included in the display up to one million is shown beneath the trace label In this example 1939 sweeps have been captured in a short delay to obtain the result displayed The most recent sweep is shown as a bright vector trace The Analog Persistence feature is also available in XY and Sequence Modes 67 3 Press the for Persistence Setup ...

Page 76: ...ppear with each additional trace very useful when four traces or functions are shown on screen and persistence will not be applied to all The Persist for menu offers a choice of persistence duration in seconds If the duration is set for example at one second each acquired trace will be displayed for a second and then deleted The default value for this menu is QILQLWH The screen will then display 7...

Page 77: ... the data The brightness level of a single color is used to denote signal intensity Particular populations are given distinguishing shades of color These are dynamically updated as data from new acquisitions are accumulated Population distributions in rare events can be highlighted by additional saturation as illustrated in the screen at right Then turn the lower menu to adjust the value of the sa...

Page 78: ...recent sweep is shown as a bright vector trace on top of the persistence display This menu allows to show or not the last trace on top of the persistence Press the corresponding menu to select 2II from the Last Trace show menu The screen will display ...

Page 79: ...raded Persistence uses a color spectrum from red through violet to map signal intensity as shown in this example Press the corresponding to select RORU UDGHG from the Using menu The screen now displays As this guide is printed in black white only references are to monochrome renditions of the colors evident on your screen ...

Page 80: ...lor association handles multiple long waveform zooms see also Calculating on Long Waveforms SSOLFDWLRQ 6HWXS Connect the signal to be measured which can be a waveform of one million points or more to CH 2 67 3 67 3 Reset press the top and simultaneously Then press to turn off Trace 1 Press then the corresponding to select from the Coupling menu the coupling matching the source s impedance 50 Ω Acq...

Page 81: ...uisition Then to access the TIMEBASE menus Shown at the top of the TIMEBASE menus on the following screen is the number of points acquired 50 000 samples in this example At the same time the Record up to menu displays the acquired sample limit set by the user 50k ...

Page 82: ...ayed is the same as in this example 2M points Press to perform a single two million point acquisition and display Note With the long acquisition memory the maximum sampling rate is maintained at many more timebase settings than are possible with short memory scopes Particular advantages include greater waveform detail high zoom factor protection against aliasing improved time resolution wider freq...

Page 83: ...ids while preserving eight bit resolution 67 3 The following steps directly illustrate the extreme practicality of the color association system as different parts of an acquired signal are simultaneously expanded and viewed Press to make appear the DISPLAY SETUP group of menus Then to select 4XDG from the Grids menu The screen will display Now press ...

Page 84: ...Press the corresponding menu for REDEFINE Next turn the lower menu to select Then press to turn on Trace A The screen will display Use with and with to make the original signal selection and select the timebase horizontal zoom with amplitude vertical zoom This allows the selection of a part of the original signal and the part s vertical or horizontal expansion ...

Page 85: ...ce as reinforced video The RESET button cancels all the zoom changes and redisplays the original trace The screen will then display a 10x zoom of CH 2 that indicates a zone of interest 67 3 Repeat Steps 8 and 9 this time turning on Traces B and C to zoom other parts of CH 2 ...

Page 86: ... RORU VVRFLDWLRQ The screen will display 67 3 Then and to display the four grids in Full Screen mode without menus ...

Page 87: ... 0HDVXULQJ 6NLOOV The screen will display 7LSV As shown on the next screen each of the four grids can be shown with its own trace and parameters up to five at once simultaneously ...

Page 88: ... RORU VVRFLDWLRQ 67 3 67 3 Press And then the to select More Display Setup from DISPLAY SETUP Next press the to select one of the pre set numbered color schemes from Color Scheme ...

Page 89: ...lected 67 3 Now press the to select 8 from Color Scheme This allows the creation of a custom color palette 7LSV Copy preset schemes to user palettes These can then act as references and form the bases for choosing object colors in new customized color schemes ...

Page 90: ... RORU VVRFLDWLRQ The screen will display 67 3 Now press the for CHANGE COLORS and then for COPY SCHEME 1 to U1 The colors assigned to the objects in U1 will now be the same as those of the pre set 1 ...

Page 91: ...LOOV 67 3 Next press a to select an object for color change Here Trace B is selected And then a to select the color of the object selected Grass Green has been selected to replace Pale Blue in the following example ...

Page 92: ...Q Note See the Operator s Manual for a description of the displayed objects whose colors can be modified The screen will display And in the final screen on the next page Text Menu has been selected and colored Yellow ...

Page 93: ... 0HDVXULQJ 6NLOOV ...

Page 94: ...UDWRU V 0DQXDO for the limits The long intervals of deadtime that often separate consecutive single shot events are minimized in sequence mode Complicated event sequences covering large time intervals are captured in fine detail without the uninteresting periods between SSOLFDWLRQ 6HWXS Connect the signal a pulse train each group of 12 pulses separated by a long signal that need not be acquired to...

Page 95: ... to select from the Coupling menu the coupling matching the source s impedance 50 Ω Press again Turn to adjust the timebase and to adjust the gain and fill the screen with the signal This schema represents how Sequence Mode handles sequence acquisition The display is activated pressing SHOW STATUS and selecting Text Times from the menu that appears ...

Page 96: ... XWWLQJ HDGWLPH Note This screen shows only one of 12 train pulses 67 3 67 3 The screen will display Again turn to adjust the timebase this time to display all of the train s pulses Now press ...

Page 97: ...wn at top right of screen consists of in this example Timebase value 2 ms div Number of samples acquired 10 000 Sampling rate 500 MS s Time between samples 2 ns point Total time acquisition 20 ms 67 3 Again turn to adjust the timebase this time until two pulse trains are acquired ...

Page 98: ...ition has increased Between two trains a long ground level signal of no interest has been acquired Sequence Mode activated at the next step is the best way of acquiring the zone of interest only 67 3 Press Then press the corresponding menu to select 2Q from the Sequence menu Next turn the lower menu to display VHJPHQWV in the Sequence menu Press ...

Page 99: ...tion shows that two segments of 50 000 points each 2 F 50 000 have been acquired 7LSV The bottom menu shows the maximum number of points per segment in this instance 50 000 The sampling rate or the total number of acquired points can be adjusted The timebase setting in Sequence Mode is used for determining the acquisition duration of each segment 10 x TIME DIV This setting as well as the number of...

Page 100: ...already covered at Step 5 The sampling rate is the maximum and the two trains are captured with a very short delay between triggers The acquisition is in fact two acquisitions each a train of pulses 67 3 Turn the lower menu to set the number of segments On the example screen overleaf the number of segments is set at eight ...

Page 101: ... 0HDVXULQJ 6NLOOV Note The complete waveform with all its segments may not fill the screen entirely 67 3 Press Then twice press the corresponding menu to select 7H W 7LPHV from the STATUS menu ...

Page 102: ...uence waveform using the full precision of the acquisition timebase Trigger time stamps are given for each segment 7LSV Each segment can be displayed using ZOOM or used as input to the MATH package For remote operation Sequence Mode can be activated to take full advantage of the scope s large data transmission capability ...

Page 103: ...e segments continuously overwriting older segments as required A manual STOP order or time out condition can then be used to terminate the acquisition The operation of the STOP SINGLE NORMAL and AUTO buttons is modified when Sequence Mode is used see Chapter 7 of the 2SHUDWRU V 0DQXDO To ensure low deadtime between segments button pushing and knob turning should be avoided during sequence acquisit...

Page 104: ... need for another separate instrument Explained here is how to measure signal power distribution as a function of frequency SSOLFDWLRQ 6HWXS Connect the signal to be measured a CAL BNC signal at a frequency of 1 kHz to CH 1 67 3 67 3 67 3 Reset press the top and simultaneously Then press to turn off Trace 2 Press then the corresponding to select from the Coupling menu the coupling matching the sou...

Page 105: ... 0HDVXULQJ 6NLOOV 67 3 67 3 Press Press the corresponding menu to select XDO from the Grids menu ...

Page 106: ... 6SHFWUXP QDO VLV The screen will then display 67 3 67 3 67 3 Press Press the corresponding to select REDEFINE Next press the to select HV from the use Math menu ...

Page 107: ...ncy lower than that of the Nyquist in order to avoid aliasing f the distance in hertz between the center frequencies of two neighboring FFT bins where f 1 Time Div 10 500 pts the total number of FFT points Then press the to select FFT from the Math Type menu Now press to turn on TRACE A The screen will now display 7LSV To enable any Math function to use more of the acquired data press MATH SETUP a...

Page 108: ... 6SHFWUXP QDO VLV 67 3 Turn to move the trace to the right of the screen and zoom the lower frequencies The screen will then display 67 3 Turn to obtain details of the lower frequencies ...

Page 109: ... and 3 kHz The screen will then display 7LSV The frequency span can be made greater by increasing the number of points acquired There are several ways of doing this but basicly acquired points are multiplied by increasing the value in the TIMEBASE Record up to menu or by selecting a slower timebase while keeping the same sampling rate ...

Page 110: ... 6SHFWUXP QDO VLV Note Rather than zoom the FFT directly it is possible to zoom on a copy of the FFT on Trace B as is shown here C or D From top Squarewave signal FFT and FFT zoom on Trace C ...

Page 111: ...quisition information Here s how to use this parameter distribution analysis firmware with histogram to display and calculate signal jitter distributed across acquisitions 6RIWZDUH 5HTXLUHG WP03 parameter distribution analysis firmware with histogram for LeCroy oscilloscopes SSOLFDWLRQ 6HWXS Connect the signal to be measured which should show edge jitter to CH 2 67 3 Reset press the top and simult...

Page 112: ...VWRJUDPV 67 3 67 3 67 3 Press then the corresponding to select from the Coupling menu the coupling matching the source s impedance 50 Ω Press again Turn to select a single period of the signal The screen will display ...

Page 113: ...g DISPLAY and then the menu button to select 2Q from the Persistence menu the signal can be displayed with edge jitter in persistence mode as shown here Persistence should then be turned off 67 3 Press to access the ZOOM MATH menus And then press the corresponding s for REDEFINE and then to select HV from the use Math menu ...

Page 114: ...y Note The Average function in the Math Type menu is selected by default All functions that can be set up with standard and optional software where installed are shown in this menu 67 3 Press the corresponding to select LVWRJUDP from the Math Type menu ...

Page 115: ...of one point for each histogram bin where the value of each point is equal to the number of parameter values falling into the corresponding bin Analysis of histogram distributions is supported by a wide range of automated statistical parameters and provides insight into and quantitative analysis of difficult to measure phenomena 67 3 Press the corresponding menu for MORE HIST SETUP ...

Page 116: ... QDO VLV ZLWK LVWRJUDPV The screen will now display 67 3 Press the corresponding menu for PARAMETER SETUP ...

Page 117: ...ng histograms are grouped under Statistics further down the menu and not visible here And and as the name suggests the All category covers all parameters 67 3 The screen will display Press the corresponding s or turn the upper to select from the measure menu the parameter for which the histogram is to be made ZLGWK in the example screen that follows Then press or turn the lower to select the chann...

Page 118: ...Manual for more details 67 3 7LSV Press the menu button for DELETE ALL TESTS if preliminary parameters have been set up in a previous acquisition to ensure the newly chosen parameters form the required set Press to turn off CH 2 then so that only Trace A the histogram of the width of the trace acquired on CH 2 is displayed ...

Page 119: ... display 67 3 Press to go back to the preceding menu allowing the histogram to be set up Then press the for FIND CENTER AND WIDTH As shown on the next screen the horizontal axis is set to a new scale accurately showing the distribution ...

Page 120: ... width values off screen left and right in this example all width values are within screen limits And finally it displays the number of acquired and measured parameter values used to create the histogram All values displayed in the trace label can be changed as required Because Trace A is a function horizontal and vertical scales and positions and thus zoom can be used for the histogram Pressing t...

Page 121: ...tical display parameters have been adjusted Turning the upper menu knob will change the number of bins that classify the different parameter values When this number is changed the new horizontal scale is adjusted and displayed in the trace label as shown on the facing page ...

Page 122: ...ny as two billion measurements can be included in a parameter histogram display This limit is set by pressing the RETURN button in order to go back to the SETUP OF menus The appropriate menu button or knob is then used to set the required limit in the using up to menu see screen following Step 6 ...

Page 123: ...measurements can be made on the histogram for analysis of the characteristics of selected parameters including the highest value standard deviation and the most common value of the histogram Press Then press the s to select 3DUDPHWHUV from the top menu and XVWRP from the mode menu thus enabling Custom Parameter mode The screen will display ...

Page 124: ...n the On line menu as it has been used in the calculation of the histogram However the four other parameters may be added 67 3 Press the corresponding for CHANGE PARAMETERS The screen will display Press to select a line other than from the On line menu to change this would lose the histogram data Next the to select 6WDWLVWLFV from the Category menu Then to select Histogram from the of menu ...

Page 125: ...tional parameters for characterizing the histogram A description of each of these parameters is given on screen under the grid in accordance with the parameter selected The final screens in this tutorial which follow show four different parameters characterizing the histogram of the width ...

Page 126: ...or all parameters As shown on the final screen four different values are displayed for each parameter These are average lowest highest and sigma the last being the standard deviation of the data values from the mean values Parameters can be applied to a chosen section of the histogram using the parameter cursors in the measure menu see Characterizing a Pulse ...

Page 127: ... 0HDVXULQJ 6NLOOV ...

Page 128: ...data sample This preserves the identity of the original raw data allowing differentiation of raw from interpolated data points Because it must respect the Nyquist limit to avoid aliasing it can be used only on signals having frequency components of less than half the sampling rate here a simple sinewave SSOLFDWLRQ 6HWXS Signal to acquire on CH 2 100 MHz sinewave 67 3 Reset press the top and simult...

Page 129: ...m the Coupling menu the coupling matching the source s impedance 50 Ω Press again The screen will display 7LSV The 100 MHz sinewave is sampled at a rate of 500 MS s Thus each signal period has just five points at the limit of obtaining a good representation of the signal ...

Page 130: ...quired This is done by pressing the menu button to select 2II from the Dot Join menu as shown here The number of points acquired the time between the points and the sampling rate of the acquisition are displayed when the TIMEBASE SETUP button is pressed In this example only 50 points are acquired with 2 ns between each ...

Page 131: ... 0HDVXULQJ 6NLOOV Points can be made larger and more visible bolder by pressing More Display Setup and selecting ROG from the Data Points menu The result is seen here ...

Page 132: ...INE The screen will display 67 3 67 3 Press the respective s to select HV in the use Math menu and XQFWLRQV from the Math Type menu which will appear see page 3 95 for menu details Then press the s to select 6LQ in the Function menu and from the of menu ...

Page 133: ...250 MHz The 100 MHz sinewave signal contains components whose frequency is lower than the Nyquist The interpolation Sin x x can be performed without aliasing 67 3 Press Then press the to select XDO from the Grids menu next screen 7LSV Two traces can be displayed in each grid in Dual Display Mode The first or upper grid s traces are described in the two upper first and second trace labels whilst th...

Page 134: ...es in the upper grid To display CH 2 and Trace A each on a different grid CH 2 s trace label must be placed in the first position done by pressing the CH 2 TRACE ON OFF button off and on successively TRACE A will then be placed automatically in the third position and thus displayed in the second grid 67 3 Press to display the interpolation of CH 2 ...

Page 135: ...ncreasing the time taken for the calculation The exception which needs to be approached a little differently is acquisitions performed with a slow timebase An example of this would be an acquired sinewave having 10 000 points but only four points per period In such a case it is impossible to increase the number of points However the problem is solved by selecting a zoom of less than 5000 points on...

Page 136: ...position and zoom knobs In the final screen shown here the timebase of A has been changed to show a detailed period of the signal on CH 2 There are 50 points per period on the interpolation of A giving a better representation of the acquired sinewave when compared with the original CH 2 signal ...

Page 137: ...uming with analog machines are automatic with LeCroy s software The computed Pass Fail function offers greater accuracy with ease in repeating measurements Another plus when a test fails a TTL pulse output just one example can be used to drive a separate test device eliminating the need for expensive production testing software Test masks are available on memory card or floppy And the scope is tra...

Page 138: ...ss then the corresponding to select from the Coupling menu the coupling matching the source s impedance 50 Ω Press again Having set up the scope the next step is to call up the telecom mask to be used for the test For this example from the TC1 option we use the mask CCITT G703 Fig 22 97 728 kb stored on floppy However any of the other masks available on floppy or memory card can be used Insert the...

Page 139: ... 0HDVXULQJ 6NLOOV The screen will display 67 3 Press the corresponding menu for RE READ DRIVE Then turn the upper to select the desired mask 77 Next press the corresponding menu for DO RECALL ...

Page 140: ...reen will then display Note The message G703F22 recalled from floppy will be displayed at top of screen The mask is now stored in the volatile internal memory M1 as indicated in the to menu 67 3 Press to display the recalled mask ...

Page 141: ...nt of processing memory used or both Here the function is performed simply to show the trace stored in M1 and can be considered as a zoom with a factor of one The acquisition is a 500 point trace and the default value of up to 1000 points would be sufficient 67 3 The screen will display Press the corresponding menu s for REDEFINE and then for Trace is ZOOM of 0 Then press to turn on Trace A and di...

Page 142: ...he mask Vertical gain is 20 per division meaning that each vertical division is equal to 20 of the difference between the mean top value accepted by the mask and the mask s mean base value The screen will then display The mean top value accepted by the mask and the mean base value of the mask are shown respectively as the upper and lower horizontal dotted lines on the screen The difference between...

Page 143: ...isplays the vertical unit of the mask 67 3 67 3 Turn to obtain the same timebase for both trace and mask and match one to the other Turn to position the trace so that its mean top and mean base values correspond to those of the mask ...

Page 144: ...play 67 3 67 3 Now press to do the test Then press the to select 3DUDPHWHUV Press the to select 3DVV This enables the test against masks or a parameter value to be made This test should begin with testing turned to 2II Once the tests are set up testing can then be turned 2Q ...

Page 145: ...ate menu button for CHANGE TEST CONDITIONS see next step whereby the parameter or mask to be tested can be specified Here only one line CH 2 against the mask displayed as trace A will be defined To stop or restart the test press the corresponding menu button to select On or Off from the testing menu 67 3 7LSV The test is performed only on points between the two vertical cursors These cursors can b...

Page 146: ...escription appears on the first line At this stage the test is specified as Pass if all the CH 1 trace points are inside the mask stored in Trace D 67 3 Press the s to select and from the of and mask menus CH 2 and Trace A will be tested Now press to run the test ...

Page 147: ...selected from the True if menu and inside or outside the mask from the are menu 7LSV Whether the test is a Pass or Fail any or all of the following can be activated by selecting from the CHANGE TEST menus À Stop capturing further signals À Dump the screen image to a hard copy unit À Store selected traces to internal memory memory card optional or floppy optional or hard disk À Sound a beep À Emit ...

Page 148: ... TEST FWLRQ menus Note To carry out one or more of these actions make a selection from the If menu to set whether the action or actions are to be carried out in the case of a Pass or a Fail and then press the appropriate menu buttons to make the desired selection from the Then and Stop menus ...

Page 149: ... 0HDVXULQJ 6NLOOV Note With 6WRUH HV selected if the test is a Pass then Trace 2 will be stored to floppy ...

Page 150: ...ocated at the rear of the scope Used together with the LC s Auto Store function it stores automatically after each acquisition DUGZDUH 5HTXLUHG HD01 Type III Hard Disk Adapter option available for all LeCroy oscilloscopes SSOLFDWLRQ 6HWXS Connect the waveform to be stored on CH 2 Insert the PC Card HDD in the adapter located at the rear of the scope Perform this acquisition after carrying out any ...

Page 151: ... 0HDVXULQJ 6NLOOV 67 3 67 3 Press to complete the acquisition to be stored on the hard disk drive The screen will display Now press ...

Page 152: ...e scope the final box in the on screen menu column will list a variety of waveform storage media Here the menu offers Card PC Card memory card option MC01 Flpy and HDD PC Card Hard Disk Drive HD01 After selection of the particular storage medium the procedure described in Steps 3 5 is the same for all 67 3 Press the or turn the upper to select from the store menu Then use the or the lower to selec...

Page 153: ... this tutorial Each time a trace is stored the Free value is updated The scope has a pre defined naming convention for the eight character file names For manually stored waveform files the format is Stt nnn where tt defines the trace name of C1 C2 C3 C4 TA TB TC TD and nnn denotes an automatically assigned three digit decimal sequence number starting at 001 67 3 The screen will then display Press ...

Page 154: ...edium becomes full Remaining files are then renamed the oldest group of files becoming Axx 001 the second oldest Axx 002 and so on When Auto Store is selected the waveform is stored automatically after each acquisition Two varieties of Auto Store are available Fill which stores the acquired waveform until the storage medium PC Card hard disk drive floppy or memory card is completely full and Wrap ...

Page 155: ...ng waveform zoom math and storage DUGZDUH 5HTXLUHG A LeCroy color digital oscilloscope with 64 MB of memory fitted either as standard or as an option depending on the model SSOLFDWLRQ 6HWXS Connect the signal to be measured to CH 2 and adjust the timebase to give a waveform of one million points The signal to be acquired here is an example two million point acquisition but acquisitions of up to ei...

Page 156: ...nu the coupling matching the source s impedance 50 Ω Press again Press to stop the acquisition Then At the top of the column of TIMEBASE menus on the next screen is shown the number of points acquired 10 000 samples for this example At the same time the Record up to menu at the base of the column shows the acquired sample limit set by the user 50 000 in this case ...

Page 157: ...ples is set to at least 1M points for this example it is set to 2M Turn in order to slow down the timebase and obtain more time per division until the number of acquired points displayed is the same as in this example 2M points Press to perform a single two million point acquisition ...

Page 158: ...pes Particular advantages include greater waveform detail high zoom factor protection against aliasing improved time resolution wider frequency spectrum See the LeCroy Application Note ITI 008 for details 67 3 The next step illustrates just how practical is 64 MB memory processing zooms or functions can be acquired on all two million points of the trace acquired in the preceding steps Press and th...

Page 159: ...The grid now has only eight divisions because the capture of two million points with a sampling rate of 500 MS s gives a window time acquisition of 4 ms The sole possibility of displaying a 4 ms acquisition is to use eight divisions with a timebase of 0 5 ms div 67 3 The screen will display Press Then turn the lower menu to select 10 M points max points 10000000 in the for Math use menu ...

Page 160: ...ce of the function on all acquired points This limit applies to all set functions or zooms of which some may be set to reduce the number of points implied where processing memory size limitations apply certainly not the case when the 64 MB option is installed 67 3 Press the corresponding menu for REDEFINE Turn the lower menu to select Then press to turn on Trace A ...

Page 161: ...e bottom menu in the SETUP OF menu column 67 3 The screen will display Use and and and to select the original signal selection the timebase horizontal zoom and the amplitude vertical zoom This will enable the selection of a portion of the original signal and expansion of that portion vertically or horizontally ...

Page 162: ...heck how much memory is being used and how much is still available press the SHOW STATUS button then press the corresponding menu button until 0HPRU 8VHG is selected as shown on the next screen The Memory used for storage of records readout at top left of screen details the amount of memory taken up the amount free and the total of memory When the performance of a function requires more processing...

Page 163: ... 0HDVXULQJ 6NLOOV 67 3 Press Then press the for REDEFINE B Next press the to select HV from the use Math menu And turn the lower to select CH 2 on which the trace is acquired ...

Page 164: ...solution improvement WP02 frequency domain analysis FFT and FFT power averaging as well as rescale in both the time and frequency domains and with WP03 installed histogram function for over 40 different parameters and 18 histogram parameters 67 3 The screen will now display Each of the functions noted here uses processing memory according to the algorithm applied An FFT for example consumes up to ...

Page 165: ...to be displayed and stored in the memory 67 3 The screen will display 7LSV Again in order to check how much memory is being used and how much is still available press the SHOW STATUS button then press the corresponding menu button until 0HPRU 8VHG is selected Same as for Step 11 but this time Press the menu s to select a function for Traces C and D then for selecting different functions on Trace 2...

Page 166: ... be displayed simultaneously as shown on the screen below The original signal need not be displayed for calculations to be performed on it And four functions can be performed on either of the originally acquired traces at the same time ...

Page 167: ... 6NLOOV Note In this final example four functions performed on CH 2 are displayed However CH 2 itself is not displayed The Memory Used display details the processing memory used in performing all the calculations ...

Page 168: ... of applications is vast including digital and analog electronic development telecommunications automated testing equipment ATE electromagnetic interference EMI and magnetic media studies SSOLFDWLRQ 6HWXS Connect the signal to be measured here for example a 500 kHz sinewave with glitch to CH 2 67 3 67 3 Reset press the top and simultaneously Then press to turn off Trace 1 Press then the correspond...

Page 169: ... screen shows a normal 500 kHz sinewave Observing the signal during several acquisitions would reveal the occasional glitch The goal of this measurement is to catch this event by setting a trigger adapted to it 67 3 The screen will display Press ...

Page 170: ...H 1 CH 2 CH 3 or CH 4 conditioned for the overall voltage gain coupling and bandwidth À The line voltage that powers the oscilloscope LINE This can be used to provide a stable display of signals synchronous with the power line Coupling and level are not relevant for this selection À The signal applied to the EXT BNC connector EXT This can be used to trigger the oscilloscope within a range of 0 5 V...

Page 171: ...igh pass filter network DC is rejected and signal frequencies below 50 kHz are attenuated 100 MHz for the LC564 AND LC584 SERIES For stable triggering on medium to high frequency signals À HF REJ Signals are DC coupled to the trigger circuit and a low pass filter network attenuates frequencies above 50 kHz For triggering on low frequencies À HF To be used only when necessary for triggering on high...

Page 172: ... glitch on the current signal Here the glitch s width is lower than the signal s Thus the trigger needs to be set to a smaller width than that of the signal whose own width depends on the DC trigger level If that level is set at the middle of the sinewave the width can be considered as the half period However if the level is higher the signal s width has to be considered as being less than the hal...

Page 173: ...hin a window low value signal width high values or the two limits can be combined to trigger only on signals outside a window see Capturing Rare Phenomena 67 3 Press the corresponding menu to select 2Q from the width menu Then turn the upper to adjust the value in that menu to 800 ns The screen will display Press to start the trigger ...

Page 174: ...sinewave The screen will display 7LSV In order to be sure the scope captures the glitch the trigger level has to be matched to the level at which the glitch appears In setting the Glitch trigger it is helpful to first identify the glitch shape Use Persistence see 3 D Viewing with Persistence as in the final screen ...

Page 175: ... 0HDVXULQJ 6NLOOV ...

Page 176: ...s way the oscilloscope itself contributes to increased knowledge of exceptional waveforms leading to their complete description Here s how SSOLFDWLRQ 6HWXS Connect to CH 2 a waveform whose multiple glitches because of their low duty cycle do not show up when the Edge Trigger or Persistence display is used 67 3 67 3 Reset press the top and simultaneously Then press to turn off Trace 1 Press then th...

Page 177: ... 0HDVXULQJ 6NLOOV 67 3 Press again to display 67 3 Press and then ...

Page 178: ...ge Trigger is selected by default This trigger is described by source and coupling as well as slope and level condition the same parameters used to build up the SMART Trigger 67 3 The screen will now display Press the to select 60 57 ...

Page 179: ...g on normal signals While in Exclusion Trigger mode the scope remains ready to trigger on abnormally shaped signals 67 3 The screen will then display The next step and its various stages set up the Glitch SMART Trigger to eliminate nominal pulses having a width of 50 ns one division Thus only those waveforms that do not have pulse widths of 50 ns will trigger the oscilloscope Press the to select f...

Page 180: ... 5DUH 3KHQRPHQD The screen will now display 67 3 Next press the corresponding menu to select 2Q from the width menu And turn the lower menu to set this value to 52 5 ns ...

Page 181: ...6NLOOV The screen will then display Note how the icon describing the current trigger setup shown under the grid is updated 67 3 Turn to set the trigger point close to mid screen Then press to activate the trigger ...

Page 182: ...ersistence Mode can be used to show a history of the exceptional pulse acquisitions set by pressing DISPLAY and then the menu button to select 2Q from the Persistence menu as shown on the next screen see also 3 D Viewing with Persistence page 3 31 ...

Page 183: ...bining the Exclusion Trigger with built in Pass Fail testing The trigger speeds the acquisition of exceptional pulses while the mask testing verifies the waveshape Storing the waveform or printing the screen display can individually document each exceptional pulse ...

Page 184: ...out the key waveform parameters for these exceptional pulses as shown on the final screen below For instance the parameter width shows the pulse width varying from 6 5 ns to 75 0 ns Using this new information the trigger setup can be changed to concentrate on acquiring pulses with specific characteristics ...

Page 185: ...er source transition Ideal for detecting interruptions in data streams network hang ups microprocessor crashes and others the Dropout Trigger is typically used to look for the last normal interval in a lost signal SSOLFDWLRQ 6HWXS Connect the signal to be measured a 1 kHz squarewave to CH 1 67 3 67 3 Reset press the top and simultaneously Then press to turn off Trace 2 Press then the corresponding...

Page 186: ...7 3 Note This screen shows the 1 kHz repetitive squarewave before the signal disappears 67 3 Press again to display The following steps set the trigger to capture only the last normal period of the signal and transient signal Press ...

Page 187: ...described by source and coupling as well as slope and level condition the same parameters used to build up the SMART Trigger 67 3 The screen will then display Press the corresponding menu s to select 60 57 from the top menu then for 6 783 60 57 75 5 and then URSRXW from the type menu ...

Page 188: ...te the trigger 7LSV The Dropout Trigger must be set in descending order on the SMART TRIGGER menus as follows Trigger after timeout if NO edge within timeout of previous edge In order to capture the squarewave when it disappears the timeout must be longer than the signal period There is no triggering when the repetitive signal is active because two successive edges occur in a single period 1 ms in...

Page 189: ...r until after the signal disappears Turn the upper menu to set the timeout For this example the timeout must be greater than 1 ms Now turn to set the trigger point to just left of mid screen and allow the display of the signal s last normal period The screen will now display ...

Page 190: ... RVW 6LJQDOV URSRXW 7ULJJHU Once the signal has disappeared the acquisition is performed The last screen displays the last normal period and the transient signal ...

Page 191: ...rger waveforms can be stored to removable hard disk or PC memory card see the 2SHUDWRU V 0DQXDO However for the larger traces a conversion from the LeCroy binary format to ASCII will be needed How to do this is also explained here page 3 157 The scope stores data in LeCroy s binary format conversion of which to ASCII creates an output file requiring 10 20 times the disk space of the original LeCro...

Page 192: ...DUH 5HTXLUHG PC equipped with GPIB General Purpose Interface Bus card 6RIWZDUH 5HTXLUHG gtalk exe and gt bat software free from LeCroy Contact your nearest sales office SSOLFDWLRQ 6HWXS Connect the signal to be acquired to CH 1 67 3 Press Then press the for GPIB RS232 Setup And the to select 3 if not already selected normally by default from the Remote menu ...

Page 193: ...his allows remote control by GPIB commands see the Remote Control Manual Auto read Alt D must also be disabled in GTALK The screen will display Now with the acquisition performed Type in the command gt at the DOS prompt This will run the GTALK program on the PC ...

Page 194: ...lloscope setup details 67 3 Type in the command C1 WF for the complete list of WAVEFORM command descriptions see the 5HPRWH RQWURO 0DQXDO Press Alt F to select the output linking the PC to the scope Give the output file a name GTALK PC program window Press Alt X to exit 7LSV To transfer data direct in ASCII instead of Step 2 above type the command C1 INSP Data_array_1 The file will take up 10 20 t...

Page 195: ... the data and giving the name of the file on which the data is stored on the floppy 67 3 67 3 Press to store data in a source file format Name 000 or 001 or 002 given by the oscilloscope Press the to select OS from the to menu and display Press the for DO STORE Eject the floppy from the scope and place it in the PC to complete the transfer ...

Page 196: ...y Contact your nearest sales office SSOLFDWLRQ 6HWXS Connect the signal to be acquired to CH 1 Press then press the respective s for GPIB RS232 Setup and to select 56 from the Remote menu The screen will display Note Check that the scope s RS232 setup and connections see Remote Control Manual PC default values are valid ...

Page 197: ...ope by typing in commands see Remote Control Manual for the full command list in response to prompts such as Your Choice Type in Your Choice S to store a waveform Type in Channel C1 if the waveform is on CH 1 Using for example Isis as a file name Type in Filename Isis to name the stored binary data file Press Alt X to exit RS 232 nine pin communication cabling for PC ...

Page 198: ...efilename at the DOS prompt The binary format file from the oscilloscope can now be read in ASCII by common PC software programs Open the file converted to ASCII with the application of choice 7LSV Help for Wavetran is available by typing Wavetran Conversion of data from the LeCroy binary format to ASCII format creates an output file that requires 10 20 times the disk space of the original LeCroy ...

Page 199: ...to PC so that they can be incorporated into work done using common PC software a report for example The following tutorial shows how to do this with TIFF condensed TIFF or BMP images by means of GPIB General Purpose Interface Bus floppy or RS232 communication port 7UDQVIHU E 3 DUGZDUH 5HTXLUHG Personal computer equipped with GPIB card 6RIWZDUH 5HTXLUHG gtalk exe and gt bat software free from LeCro...

Page 200: ...ng already been set up Press Then press the corresponding s first for Hardcopy Setup second to select 3 from the output to menu and third to select from TIFF TIFF compr compressed TIFF and BMP in the protocol menu Select 7 The screen will display Press again ...

Page 201: ...elect 3 if not already selected normally by default from the Remote menu The screen will display 67 3 With the acquisition performed Type gt at the DOS prompt This will run the GTALK program on the PC Note The scope s address GPIB must be 4 This allows remote control by GPIB see Remote Control Manual Auto read Alt D must also be disabled ...

Page 202: ...then need to be verified and the transfer redone 67 3 Press Alt L to control the scope in Local Mode which allows a screen dump with a selected menu but without the message Go to Local Type the command SCDP Press Alt F to select the output linking the PC to the scope Give a name to the screen dump file GTALK PC window Press Alt X to exit ...

Page 203: ...WXS The screen to be saved having already been set up Press then the corresponding s first for Hardcopy Setup second to select OS from the output to menu and third to select a file format 7 7 FRPSU or 03 from the protocol menu The screen will display ...

Page 204: ... 67 3 67 3 Press to store data in a source file on the floppy format Name 000 or 001 or 002 given by the oscilloscope Eject the floppy from the scope and place it in the PC The TIFF or BMP can now be directly imported into files run on common software that recognizes its file format ...

Page 205: ...LFDWLRQ 6HWXS Capture signal for transfer on CH 1 Press then the s first for Hardcopy Setup second to select 56 from the output to menu and third to select a file format 7 7 FRPSU or 03 from the protocol menu Again press then the s for GPIB RS232 Setup and 56 from the Remote menu to display Note To save the image of a complete acquisition first press STOP or SINGLE ...

Page 206: ... oscilloscope by typing in commands see Remote Control Manual for the full command list in response to prompts such as Comment LCRS232 program window Type in Your choice D to send the image file to the PC Type in Comment text if a comment is desired to be placed on the TIFF image above the grid A name or title could be inserted such as Comment For Isis Report Again using Isis as an example name Ty...

Page 207: ...cilloscope And this first hand experience should make all your measurements easier The guide can continue to serve as a practical reference to turn to as required Use it together with the accompanying Operator s Manual keeping both close at hand We wish you excellent measuring C A P T U RE VIE W AN A L Y Z E ...

Page 208: ...on 3 62 capturing 1 4 1 5 1 7 1 6 channel input sensitivity adjusting 3 7 CLEAR SWEEPS button 3 15 3 29 for setting or clearing persistence 3 35 Color 3 39 choosing color schemes 3 47 3 48 Color Graded Persistence 3 38 communication port RS232 3 158 controls front panel main controls See front panel controls coupling 3 3 3 130 four channel models 3 3 COUPLING button in first steps common to most m...

Page 209: ... digitizing 3 6 3 8 Enhanced Resolution option 3 123 exclusion trigger SMART 3 138 EYE diagram analysis 1 10 Fast Fourier Transform FFT WP02 FFT option See spectrum analyzer frequency domain analysis FFT 1 9 2 20 2 21 See Fast Fourier Transform first steps common to most measurements 3 1 3 5 Floppy disk 3 162 Floppy disk 3 154 frequency domain analysis 1 9 3 63 3 69 frequency resolution to increas...

Page 210: ...memory length 1 4 menu box 2 5 2 10 2 17 menus Action 3 107 at end of 3 138 Auto Store 3 113 Avg Type 2 19 Avg Type averaging type 3 29 Category 3 76 3 83 CHANGE COLORS 3 49 Change Test 3 107 Color Scheme 3 47 Coupling 3 3 3 6 3 10 3 17 3 26 3 31 3 39 3 54 3 63 3 71 3 88 3 97 3 115 3 127 3 135 3 144 DISPLAY SETUP 3 33 3 42 Dot Join 3 89 for Math use 3 100 3 118 FROM DEFAULT SETUP 2 5 fromMemory 2 ...

Page 211: ... parameters 2 16 automatic measurement of 3 9 categories of See menus Category in telecom mask testing 3 103 menu See menus read by remote control 3 15 standard See standard parameters statistical analysis See histograms values 3 14 vertical See vertical parameters with histograms 3 75 3 86 Partial Response Maximum Likelihood PRML 1 10 Pass Fail function 1 6 1 10 See telecom mask testing with excl...

Page 212: ...eform acquisition 3 121 Sin x x interpolation See interpolation SINGLE button 2 20 single shot acquisition 1 5 slow timebase acquisition using interpolation 3 94 SMART trigger 1 6 3 135 3 143 See edge dropout interval triggers in glitch capture 3 130 3 131 SNGL button for long waveform acquisition 3 116 for storing to hard disk 3 110 to stop acquisition 3 115 used to stop scope 3 17 source selecti...

Page 213: ...on 2 11 TRIGGER SETUP button 3 136 glitch capture 3 128 on lost signals 3 145 triggering 1 6 8 use Math menu 2 19 UTILITIES button 3 159 9 VAR button 2 2 2 10 3 7 vertical parameters 3 12 viewing 1 4 1 7 VOLTS DIV knob 2 10 2 23 waveform math 1 8 waveform memories 2 21 WAVEFORM STORE button 2 22 WP01 waveform processing 3 123 WP02 FFT 3 123 WP03 waveform processing 3 123 See histograms XY mode per...

Reviews: