TRIG:DLOG:SOUR BUS
INIT:DLOG “External:\log1.csv”
To turn on Output 1 and run the data logger:
OUTP ON, (@1)
*TRG
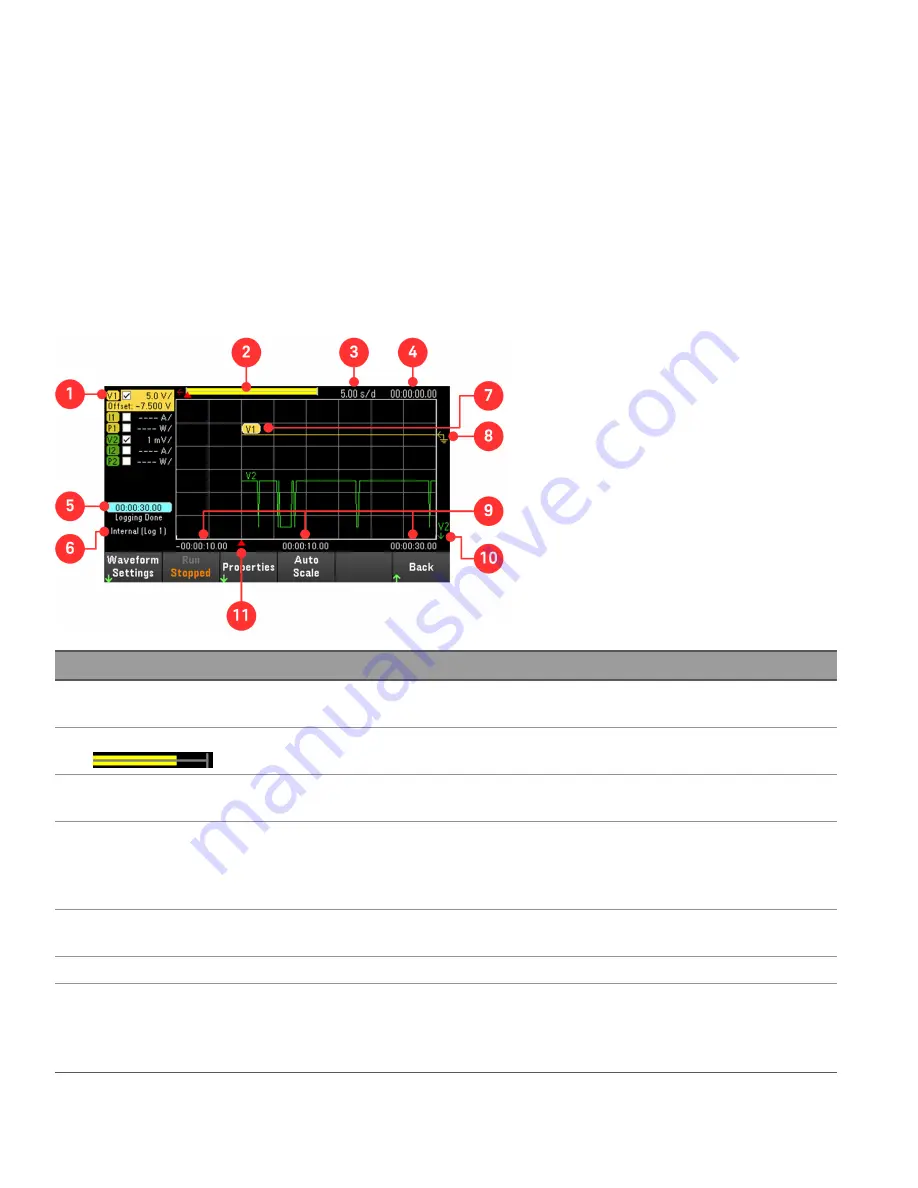
Data logger view
Press
Data Logger
to access the data logger.
Items
Description
1
Trace controls
Identifies the voltage or current trace that will be displayed. √ indicates the trace is on. Dashes (----)
indicate the trace is off. Select the trace and press [Enter] to turn it on or off.
2
Data bar
The data bar represents all of the logged data. The yellow part indicates the portion of the data that is vis-
ible on the display. The black part represents the data that is not visible.
3
Time/Div
Identifies the horizontal time-base setting. This can be adjusted using the Horizontal Time/Div + and
Time/Div – in Waveform Settings.
4
Offset time
Indicates the time that the right gridline is offset or away from the end of the data log. When this value is
zero, it means that the right gridline is positioned at the end of the data log. Adjusting the offset using the
Horizontal and Offset – in Waveform Settings will move the grid away from the end of the data
log, as indicated by the Offset Time.
5
Time elapsed
Indicates the time elapsed during the data log and the total duration. The values match when data log-
ging finishes.
6
Filename
Indicates the filename of the data that is being logged.
7
Output traces
Voltage trace labels appear on the left side of the grid (V1 and V2) as shown in the display.
Current trace labels appear on the right side of the grid (I1 and I2).
Power trace labels appear on the center of the grid (P1 and P2).
Press Auto Scale to auto-scale the data traces.
98
Keysight E36200 Series User's Guide


