imum number of seconds to pan can be configured in the global settings (
Plot History
in Sec-
tion 4.11.2). If panning is active, plots are not updated with new sample data.
The RTC buttons can be used the set and get the time of the
Real-Time Clock
of a node. The
RTC is also set automatically when a node is discovered by Inertia Studio. When setting the
time, the current UTC time of the PC is send to the nodes.
Detailed Status
The
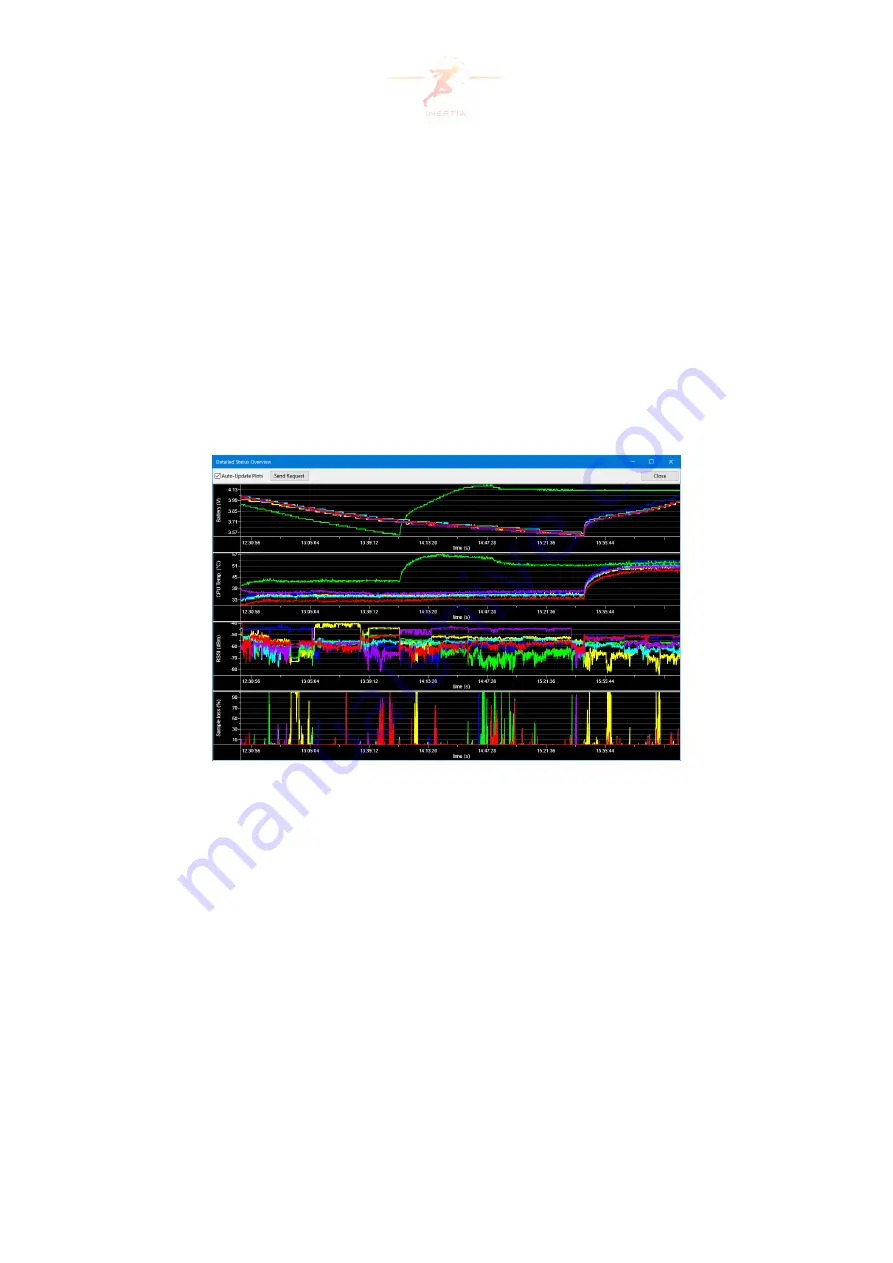
Detailed Status Overview
window (see Figure 9) can be accessed by double clicking an item
in the legend or via the
View
menu, sub-menu
Detailed Status
. The window shows detailed
information about the battery level, CPU temperature, RSSI and sample loss of the connected
nodes. The plots are cleared when (re)connecting to a device.
Figure 9: Detailed Status information
The battery and temperature plots are updated when status information from a node is re-
ceived via automatic status messages (usually every ten seconds). The RSSI plot is updated
every second with the average value of the received RSSI information. The sample loss plot
is updated every second with the detected sample loss. The time on the X-axis is the system
time. A battery is fully charged when the voltage is around 4.15 V. The node powers down
when the voltage drops below 3.45 V.
A checkbox is available to disable automatic updating of the plots. This can be used to prevent
the plots from resetting when zoomed in. The
Send Request
button broadcasts a message to
all nodes with a request to send the current battery and CPU temperature value.
Page 15 of 60


