—
Manual (F1)
opens the Inertia Studio manual.
—
About
shows the current Inertia Studio version and build date.
4.1.2
Plots
Inertia Studio can be configured to display a customizable number of plots that show in real-
time the sensor data (e.g. accelerometer data), status data (e.g. battery voltage, lost samples)
and processed data (e.g. orientation, Norm, FFT). The shown plots and layout can be cus-
tomized via the Layout Wizard (see Section 4.11.1). The X-axis of the time-plots represent the
number of seconds since the gateway was started.
The mouse can be used to zoom and pan the plot. Holding the left mouse button while moving
the mouse creates a zoom-box. Releasing the left mouse button zooms to the selected data.
Not that
Auto-scaling
resets the Y-axis zoom. A plot can be panned by holding the right mouse
button and moving the mouse. By default, the X-axis is automatically set to the latest received
data. Disable
Show Data
or use the pan slider (see Section 4.1.3) to prevent this.
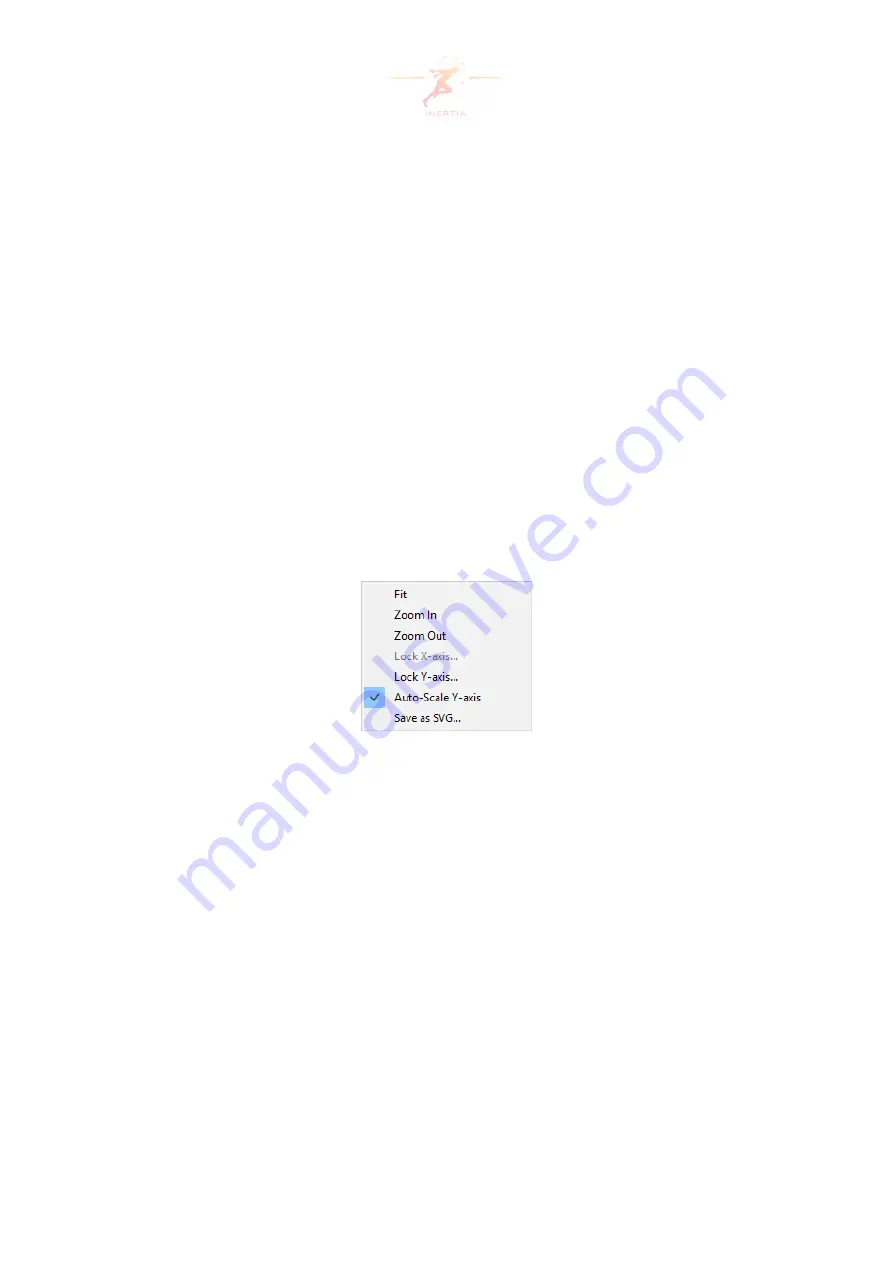
Right-clicking on a plot provides the following options (see Figure 8):
Figure 8: Plot right-click pop-up menu
•
Fit
: Fits all received data in the plot.
•
Zoom in/out
: Zooms the plot in or out. The
Zoom
buttons in the toolbar and the
Auto-
scaling
option (see Section 4.11.3) can be used to reset the zoom.
•
Lock X-axis...
: Locks the X-axis to a specified range by showing a pop-up window in which
the minimum and/or maximum values of the X-axis can be set. When the axis is locked,
a
←
and/or
→
symbol is shown at the bottom right and/or left corner of the plot. This
option is only enabled for FFT plots.
•
Lock Y-axis...
: Locks the Y-axis to a specified range by showing a pop-up window in which
the minimum and/or maximum values of the Y-axis can be set. When the axis is locked,
a
↑
and/or
↓
symbol is shown at the left top and/or bottom corner of the plot. Locked
plots do not auto-scale.
•
Auto-Scale Y-axis
: Toggle automatically scaling the Y-axis. This overrules the global auto-
scaling option in Section 4.11.3.
Page 13 of 60


