Commissioning and first steps
37/166
Note:
The values of the data points in a chart are refreshed according to
the
Data Publishing Interval
defined for the sensorEDGE data
messages. The interval can be defined on the
Device Details
page
of the
Device Manager
in the Portal (see section
Alternatively, the interval can also be set in the
Local Device
Manager
under
netFIELD App IO-Link Configurator
>
Dashboard
>
Payload
>
Refresh interval
page 99]).
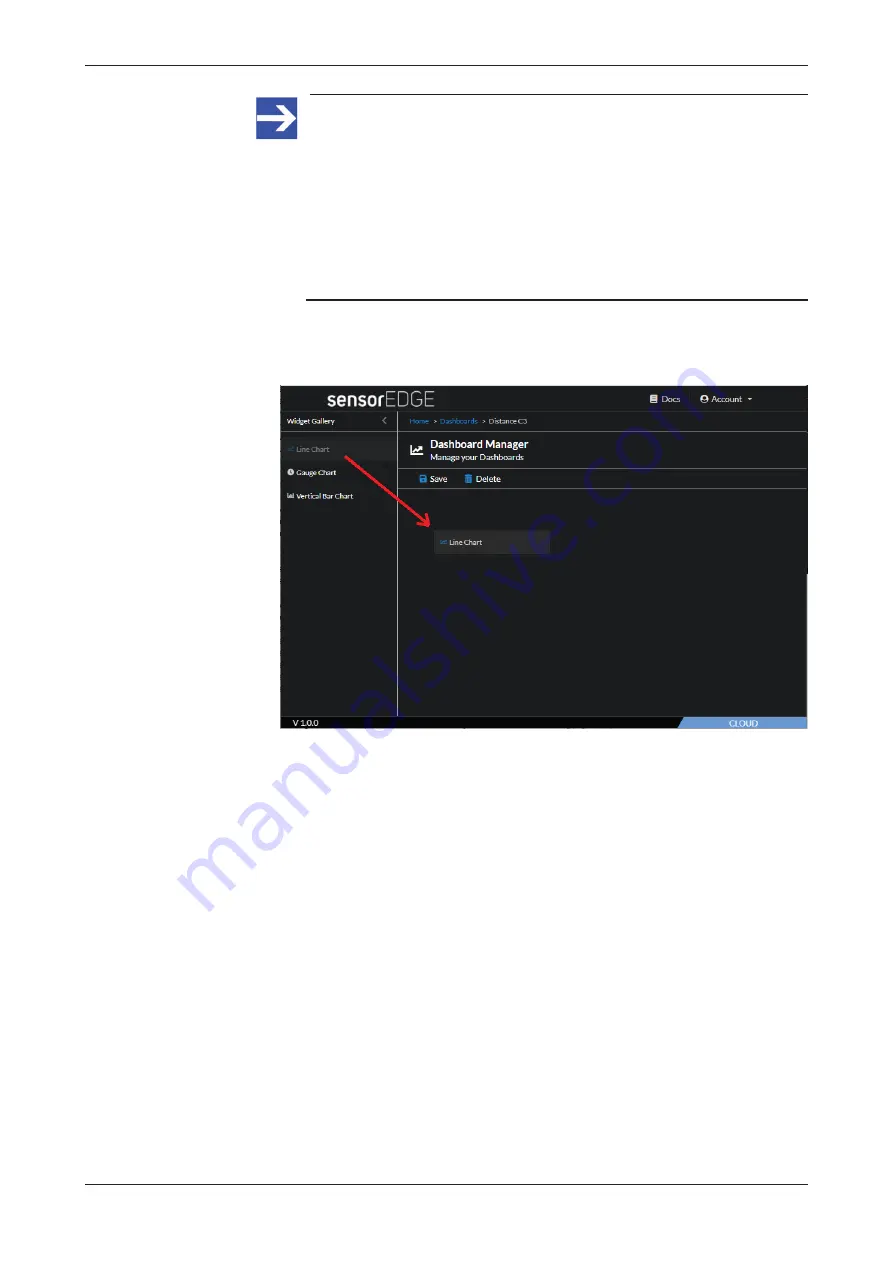
3. Select a chart widget.
Ø
Drag and drop a widget, e.g. the
Line Chart
, onto the empty space of
your dashboard:
Figure 14: Drag and drop widget
netFIELD sensorEDGE | User manual
DOC200601UM01EN | Revision 1 | English | 2021-09 | Released | Public
© Hilscher 2021


