background image

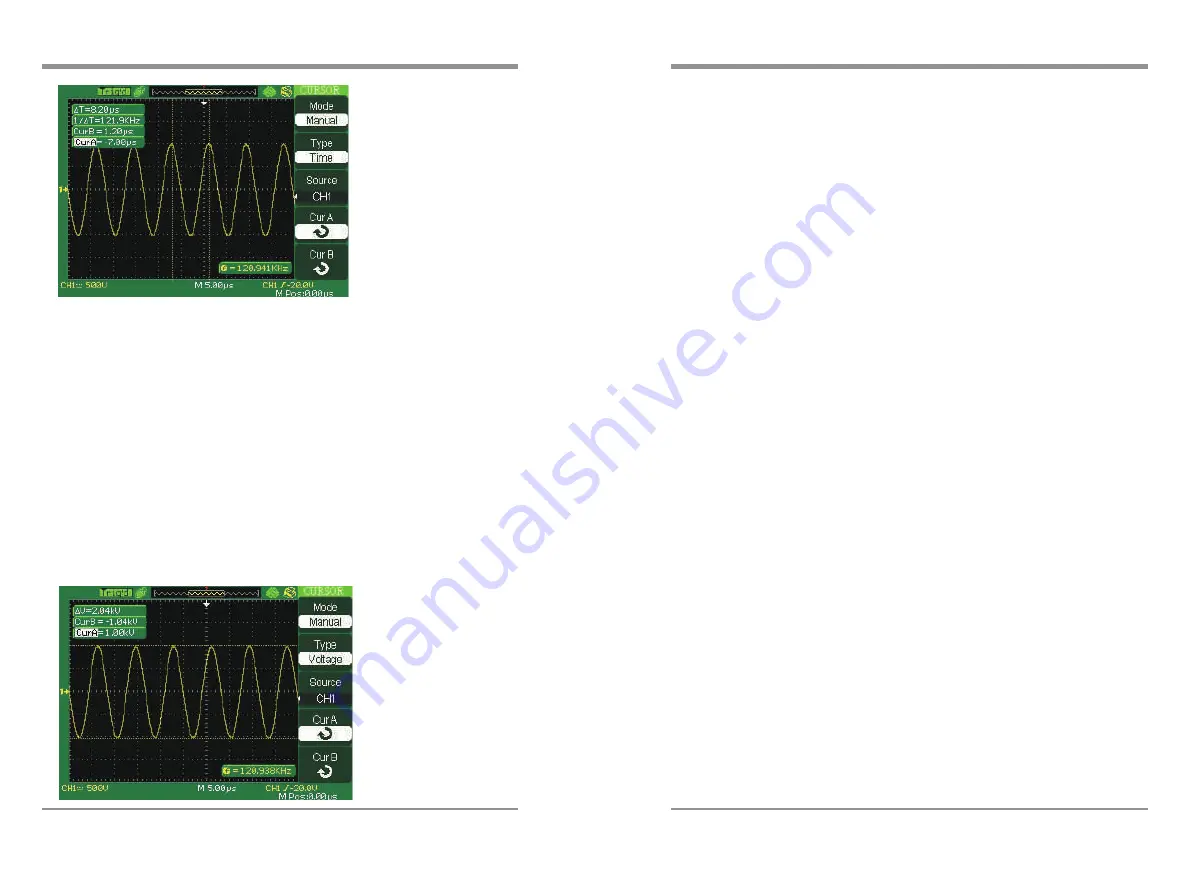
3.2.2  Measuring Ring Amplitude

To measure the amplitude, follow these steps:
     

     Press

 the CURSORS button to see the Cursor Menu.


     Press

 the Mode button to select Manual.


     Press

 the Type option button and select Voltage.


     Press

 the Source option button and select Ch1.


     Press

 the CurA option button and turn the universal knob to place the 

           cursor A on the highest peak of the ring.
     

     Press

 the CurB option button and turn the universal knob to place the 

           cursor B on the lowest peak of the ring.

You can see the following measurements on the top of the left screen:
     

     The

 delta voltage (peak-to-peak voltage of the ringing)


     The

 voltage at Cursor A.


     The

 voltage at Cursor B.

3.3 Catch the single signal

To capture a single event, you need to gather some pre-test knowledge of the signal
in order to correctly set up the trigger level and slope .if you are not sure the 
instance of the signal, you can observe it through auto or normal trigger mode to 
ensure the trigger level and slope.

The following steps show you how to use the oscilloscope to capture a single event.

1.  Set the Probe option attenuation to 10X and set the switch to 10X 
     on the probe.
2. Trigger set up:
     

     Press

 “TRIG MENU” button to show the “Trigger Menu”


     Under

 this menu, set the trigger type to “edge”, Edge type is “Rising”, 

           source  is “CH1”, trigger mode is “Single”, coupling is “DC”
     

     Adjust

 the horizontal time base and vertical scale to the satisfied range


     Turn

 the “LEVEL” knob to adjust the trigger level


     Press

 the “RUN/STOP” button to start capturing

When the trigger conditions are satisfied, data appears on the display representing; 
the data points that the oscilloscope obtained with one acquisition and press the 
RUN/STOP button again rearms the trigger circuit and erases the display.    

3.4 Analyze the signal detail

You have a noisy signal displayed on the oscilloscope and you need to know more 
about it. You suspect that the signal contains much more detail than you can now 
see in the display.

3.4.1 Looking at a Noisy Signal

The signal appears noisy and you suspect that noise is causing problems in your 
circuit. To analyze the noise better, follow these steps:
     

     Press

 the ACQUIRE button to see the acquire menu.


     Press

 the Acquisition option button or turn the Universal knob to 

            select Peak Detect.
     

     If

 necessary, press the DISPLAY button to see Display menu. Turn 

           the Universal knob to adjust waveform intensity and grid brightness to 
           see the noise more clearly.
     

     Peak

 detect emphasizes noise spikes and glitches in your signal, specially 

            when the time base is set to a slow setting.

106


Digital

 S

torage

 O

scilloscope


Digital Storage Oscilloscope


107


Summary of Contents for 500MSa/s

Page 1: ...lash drive save recall function Cursor measure covers Manual mode Track mode and Auto mode Channel waveform and its FFT waveform display on split screen Waveform Intensity and Grid Brightness can be a...

Page 2: ...duct manual for further ratings information before making connections to the product Do Not Operate Without Covers Do not operate this product with covers or panels removed Use Proper Fuse Use only th...

Page 3: ...l contains operating information for the Digital Storage Oscilloscopes The manual consists of the following chapters Digital Storage Oscilloscope Digital Storage Oscilloscope Catalogue Digital Storage...

Page 4: ...ion Matching probes attenuation coefficient Digital Storage Oscilloscope Digital Storage Oscilloscope 01 2 12 Storage System 70 2 13 Utility System 83 2 13 1 System status 87 2 13 2 Language 87 2 13 3...

Page 5: ...6 Show the waveform s channel position 7 Signal Coupling symbol 8 Readout shows the vertical factor of the channels 9 B icon shows that bandwidth function is open 10 Readout shows the main time base...

Page 6: ...firmly inserting the tip onto the probe 2 Attach the probe tip to the PROBE COMP 3V connector and the reference lead to the PROBE COMP Ground connector Display the channel and then push the AUTO butt...

Page 7: ...ion is set to Off after leaving the Cursor Menu but are not adjustable DISPLAY Display the Display Menu UTILITY Display the Utility Menu DEFAULT SETUP Recall the factory setup HELP Enter the online he...

Page 8: ...o button See picture 2 3 Table 2 2 Auto set the function item Acquire Mode Adjusted to Sampling Display Format Y T Display Type Set to Dots for a video signal set to Vectors for an FFT spectrum otherw...

Page 9: ...to save or recall them and you can adjust the Universal knob to select menu option 2 6 Vertical System Showing as follow picture the buttons and knobs are useful in the vertical system Volt div knob...

Page 10: ...component of the input signal PressCH1 Coupling DC Set to DC couple mode Both DC and AC component could be obstructed PressCH1 Coupling GND Set to GROUND mode It disconnects the input signal Set to A...

Page 11: ...s It will be helpful when you need to adjust the waveform vertical size in smooth steps Set to Coarse Set to Fine 4 Probe attenuation set In order to assort the attenuation coefficient you need to res...

Page 12: ...hows the results after and FFT operation of the CH1 and CH2 Press the MATH button to display the waveform math operations Press the MATH button again to remove the math waveform display Table 2 6 MATH...

Page 13: ...xt Page Page 1 2 Enter the second page of FFT menu To use the Math FFT mode you need to perform the following tasks 1 Set up the source time domain waveform Press the AUTO button to display a YT wavef...

Page 14: ...FT window instruction Function Setting Introduction Rectangular Best frequency resolution worst magnitude resolution This is essentially the same as no window Symmetric transients or bursts Equal ampl...

Page 15: ...ess CH1 button to display CH1 menu Turn the S div knob to adjust sampling rate at least double bigger than frequency of input signal If FFT display on full screen press CH1 button again to remove chan...

Page 16: ...ce waveform to the chosen reference location REFA REFB On Off Recall the reference waveform on the screen Turn off the reference waveform Press the Ref button to display the Reference waveform menu Op...

Page 17: ...ses the waveform to expand or contract around the screen center Horizontal POSITION knob 1 Adjust the horizontal position of all channels and math waveforms the position of the trigger relative to the...

Page 18: ...If waveform acquisition is stopped using the RUN STOP or SINGLE button turn the S div knob to expand or compress the waveform 2 Select the horizontal time div scale factor for the main or the window...

Page 19: ...he events that led up the trigger point everything to the right of the trigger point is called posttrigger information the amount of delay range pre trigger and posttrigger information available is de...

Page 20: ...want the oscilloscope to acquire a single waveform press the SINGLE button Set up Enter the Trigger Setup Menu See table 2 14 32 Digital Storage Oscilloscope Digital Storage Oscilloscope 33 1 Set up T...

Page 21: ...he Set Pulse Width option Set Width 20 0ns 10 0s Selecting this option can turn the universal to set up the pulse width Next Page Page 1 2 Press this button to enter the second page 34 Digital Storage...

Page 22: ...nu 36 Digital Storage Oscilloscope Digital Storage Oscilloscope 37 Table 2 19 Functional Manu of Video Trigger 2 Option Setting Introduction Type Video When you select the video type put the couple se...

Page 23: ...inted line number 4 Set up Standard Press the Next Page Page 2 2 option button Press the Standard option button to select PAL SECAM or NTSC 38 Digital Storage Oscilloscope Digital Storage Oscilloscope...

Page 24: ...serve two irrelative signals at the same time You can select different trigger types for two vertical signals and selected types cover edge pulse video and slope trigger Trigger information of two cha...

Page 25: ...ess this button to return the first page Option Setting Introduction Type Alternative The trigger signal comes from two vertical channels when you use alternative trigger In this mode you can observe...

Page 26: ...el 1 and channel 2 Press the AUTO button Press the TRIG MENU button to enter trigger menu Press the Type option button to select Alternative Press the Source option button to select Ch1 Press the S di...

Page 27: ...er during the holdoff time For a pulse train you can adjust the holdoff time so the oscilloscope triggers only on the first pulse in the train If you want to change holdoff time please follow next ope...

Page 28: ...nes how the signal is digitized and the time base setting affects the time span and level of detail in the acquisition Advantage You can use this mode to reduce random noise Disadvantage This mode doe...

Page 29: ...while waiting for the trigger condition to occur Detect the trigger condition Continue to acquire data until the waveform record is full Display the newly acquired waveform Base time The oscilloscope...

Page 30: ...em The display function could be expressed by the DISPLAY Button Table 2 30 Display system function menu 1 Option Setting Introduction Type Vectors Dots Vectors fills the space between adjacent sample...

Page 31: ...lay mode Grid Display grids and axes on the screen Turn off the grids Turn off the grids and axes Menu Display 2sec 5sec 10sec 20sec Infinite Set menu display time on screen Next Page Page 2 3 Press t...

Page 32: ...lloscopes restrict sampling rate at 1MSa s support 5KSa s 200MSa s 1 2 5 5 sequence adjusted The other series support 25KSa s 500MSa s 1 2 5 5 sequence adjusted 4Kpts memory depth Series Operate Intro...

Page 33: ...plays the voltage in relation to time and test the wave form displayed There are scale Cursor and auto measure modes 2 11 1 Scale Measurement This method allows you to make a quick visual estimate For...

Page 34: ...iversal knob to move cursor1 and cursor2 They could be moved when the corresponding cursor option are selected and cursor value will display on the bottom left and top left of the screen when you move...

Page 35: ...al knob to move Cursor B horizontally The measurement values are displayed on the left of the top corner A T The horizontal position of Cursor A Time cursor centered around the midpoint of screen A V...

Page 36: ...Cycle Vrms Vrms ROVShoot FOVShoot RPREShoot FPREShoot Display the corresponding icon and measure value of your selected Voltage measure parameter Return Return to the first page of auto measurement me...

Page 37: ...ig and Vlow of a waveform The arithmetic mean over the first cycle in the waveform The arithmetic mean over the entire waveform The true Root Mean Square voltage over the first cycle in the waveform T...

Page 38: ...rce option button to select CH1 or CH2 according to input signal channel Press the Type option button to select the parameter type that you want to measure The corresponding icon and value will displa...

Page 39: ...ctures Select operating object Create new needed folder Delete present folder Select operating object Create new files in present directorys Delete present file Recall stored files or present settings...

Page 40: ...e Save to option button to select Device Press the Setup option button to select No 1 Press the DISPLAY button to enter the Display menu Press the Type option button to select Dots Press the SAVE RECA...

Page 41: ...Storage Recall waveforms in the oscilloscope Save to Device Save waveforms to the oscilloscope s internal memorizer waveform No 1 to No 20 Press the waveform option button or turn the Universal knob...

Page 42: ...the oscilloscope and wait that the oscilloscope has initialized USB flash drive about ten seconds Press the Save to option button to select File Press the Save option button then you ll go into the Sa...

Page 43: ...then you ll go into the Save Recall interface Create a file then press the Confirmbutton about ten seconds there is a prompting message that Save data success displaying on the screen now waveform da...

Page 44: ...scope can display reference waveforms at a time Table 2 49 Picture storage function menu Option Setting Introduction Type Pictures Menu for the Storage Recall waveform interface image Print Key Print...

Page 45: ...ve seconds there is a prompting message that Save data success displaying on the screen now CSV file has been saved to USB flash drive 2 13 Utility System UTILITY The Utility System Button Table 2 51...

Page 46: ...hen you execute EasyScope software please select Computer Now the computer icon displays on the screen Next Page Page 2 4 Press this button to enter third page Table 2 53 Functional Menu of the Utilit...

Page 47: ...display a series of information about this oscilloscope Table 2 56 System status instruction Option Introduction Startup Times List the boot strap times Software version List the software version Hard...

Page 48: ...rmal Draft Fine ID Print Default On Off Next Page Page 2 2 Press this button to enter first page of print setup menu Displays Settings available on your PictBridge compatible printer Table 2 57 Print...

Page 49: ...at the most measurement precision You can run this procedure at any time If the operating temperature changes by more than 5 C or the units run less than thirty minutes you should do the self calibrat...

Page 50: ...s the Single for test 2 Keyboard Test Select keyboard Test to enter the key test interface the on screen lathy rectangle shapes represent the front panel keys The shapes with two arrows beside them re...

Page 51: ...ging the input signal is within the predefined mask or not Table 2 61 Pass Fail function menu 2 Option Setting Introduction Output Pass Fail Output when pass condition detected Output when fail condit...

Page 52: ...the Source option button to select input signal channel Press the Next Page Page1 2option button to enter the second page of the Pass Fail menu Press the Mask Setting option button to enter the first...

Page 53: ...e select the Universal knob to adjust the max record frame Press in Operateoption to record waveform Play Back Play back current record waveforms or saved record waveforms Table 2 65 Waveform play bac...

Page 54: ...Return Press to return the waveform recorder main menu Next Page Page 2 2 Return to the first page of Play Back function menu 100 Digital Storage Oscilloscope Digital Storage Oscilloscope 101 2 13 9...

Page 55: ...n buttons to see its help information Table 2 69 Recorder s Setting Menu Option Setting Description Viewer Full Screen Split Waveform of Full screen recording and channel recalling Waveform of recordi...

Page 56: ...ton to enter the Time Measure menu Press the Source option button to select input signal channel Press the Type option button to select Freq The corresponding icon and measure value will display on th...

Page 57: ...Menu Under this menu set the trigger type to edge Edge type is Rising source is CH1 trigger mode is Single coupling is DC Adjust the horizontal time base and vertical scale to the satisfied range Turn...

Page 58: ...urn the Volts Div knob to ensure that the entire video signal is visible on the screen 3 5 2 Triggering on Video Lines 3 6 Application of X Y function Viewing Impedance Changes in a Network Connect th...

Page 59: ...ontal position is at a limit when you turn the horizon position knob Volts Div at limit Mention you that the vertical voltage have already touched the Min 2MV div or the Max 5V div Volts position at l...

Page 60: ...ger mode Attempt to change the coupling into HF Reject or LF Reject display so that the High low frequency noise disturb the trigger should be filtrated 5 Press RUN STOP button but no display Check th...

Page 61: ...cifications the oscilloscope must first meet the following conditions The oscilloscope must have been operating continuously for thirty minutes within the specified operating temperature You must perf...

Page 62: ...MHZ 40 when using probe X1 Measure System Auto Measure 32 Types Vpp Vmax Vmin Vamp Vtop Vbase Vavg Mean Crms Vrms ROVShoot FOVShoot RPREShoot FPREShoot Rise time Fall time Freq Period Wid Wid Dut Dut...

Page 63: ...Operating 3000m Not operating 15 266m X Y Mode X pole Input Y Pole Input Channel 1 CH1 Channel 2 CH2 Phase Error 3 degrees Sample Frequency XY mode has a breakthrough that trad oscilloscopes restrict...

Page 64: ...oom Scale Display CH1 Hanning 1X dBVrms Split Standard Accessories CURSOR Type Off Source CH1 Horizontal voltage 3 2divs Vertical time 5divs MEASURE Source CH1 Type average ACQUIRE three mode options...

Page 65: ...re the LCD display will be exposed to direct sunlight for long periods of time CAUTION To avoid damage to the instrument or probes do not expose them to sprays liquids or solvents Cleaning If this ins...

Reviews: