Displaying and Configuring Data
2-3
February 2009
View Option
The second option, View, allows you to select the presentation of a
parameter in one of three formats: numeric, bar graph or line graph.
1.
From the Display Menu, press the [
X
] key once to reach the View
option, and then press
[ENTER]
.
2.
A drop-down menu shows the three formats. Scroll to the
appropriate selection.
3.
Press
[ENTER]
to confirm your selection.
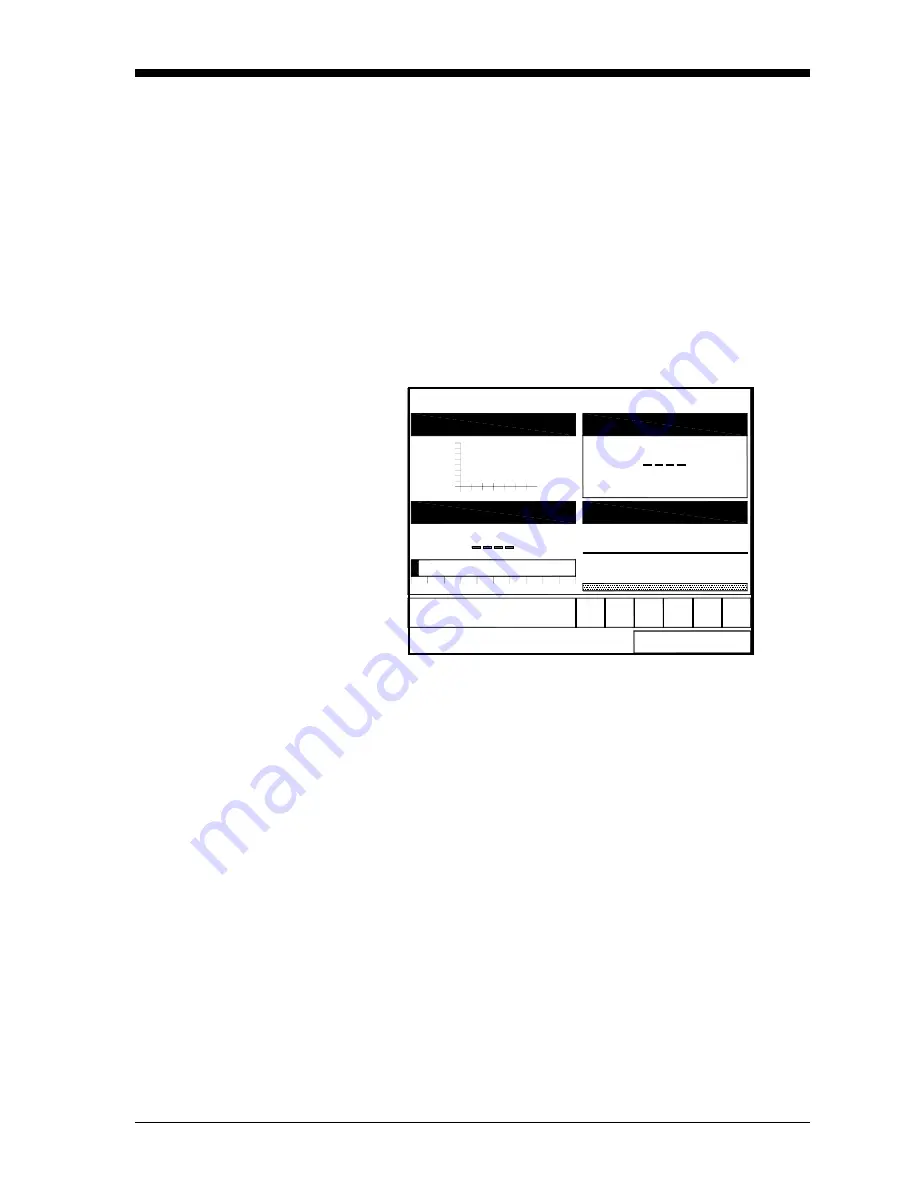
The screen immediately displays any changes. For example, if you
have changed the first parameter to a line graph, the screen appears
similar to Figure 2-3 below.
Figure 2-3: Screen After Format Change
Limits Option
Once you have configured a parameter as a line or bar graph, you
might need to change its presentation or values. The Limits option
(replacing the Format option for line and bar graphs) enables you to
program the minimum or maximum values displayed, the time
interval and the display of the average value.
To enter the Limits option:
1.
Press
[SEL]
from the Operate Mode window until you have reached
the desired measurement.
2.
Press
[ENTER]
to open the Display Menu.
3.
Be sure the Limits option is highlighted, and press
[ENTER]
.
4.
A drop-down menu entry, Change, appears. Press
[ENTER]
again.
0
50
100
-10000
10 Minutes
10000
site02 2003/07/17 03:35 PM
0
Save Now
Velocity, m/s
Volume, m/s
Corr SNR
Cross Corr
Summary of Contents for CTF878
Page 1: ...GE Sensing Model CTF878 Clamp On Tag Flowmeter Programming Manual ...
Page 2: ...GE Sensing Model CTF878 Clamp On Tag Flowmeter Programming Manual 910 254PA4 February 2009 ...
Page 7: ...Chapter 1 ...
Page 47: ...Chapter 2 ...
Page 59: ...Chapter 3 ...
Page 60: ...Creating and Managing Sites Introduction 3 1 Site Manager 3 2 ...
Page 73: ...Chapter 4 ...
Page 89: ...Chapter 5 ...