


February 2009
2-4
Displaying and Configuring Data
Limits Option (cont.)
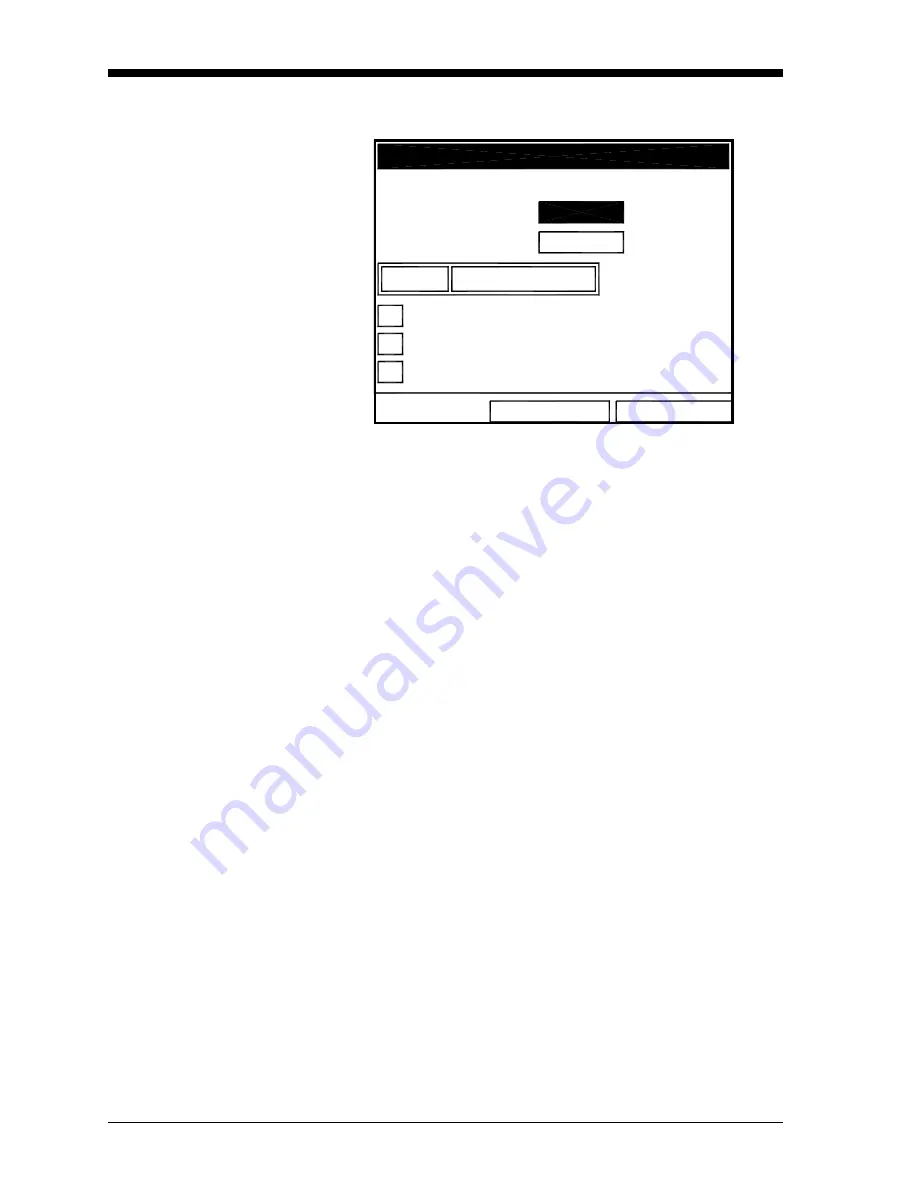
The screen appears similar to Figure 2-4 below.
Figure 2-4: Line (or Bar) Graph Parameters Window
5.
The first prompt asks for the minimum value shown in the graph.
a.
Press
[ENTER]
to open the text box.
b.
Use the numeric keys to enter the desired value.
c.
Press
[ENTER]
to confirm the value.
6.
Repeat the procedure in step 5 to enter the maximum value.
A line graph involves two more prompts.
7.
The next prompt asks for the display interval.
a.
Press
[ENTER]
to open the text box. Use the numeric keys to
enter the desired number. Press
[ENTER]
to confirm the value.
b.
The second box asks for the interval in terms of seconds,
minutes, hours, or days. Press
[ENTER]
to open the drop-down
menu, and then press the [
T
] or [
S
] keys to move to the
desired parameter. Press
[ENTER]
to confirm the entry.
8.
The final three prompts ask for details of the graph configuration:
if you want to use lines, plot the average value, or show the
minimum and maximum values. Press the [
T
] key to step
through each value, and press
[ENTER]
to add a given detail as part
of the graph.
9.
When you have configured the graph, press
[F3]
(OK) to confirm
the graph settings, or press
[
F2
]
(Cancel) to cancel the changes.
The screen returns to Operate Mode, and displays any changes.
OK
Cancel
Use Lines
Plot Average Value
Show Minimum and Maximum
Minimum
Maximum
10000
10
Minutes
Tau
Set Line Graph Parameters
-10000
Summary of Contents for CTF878
Page 1: ...GE Sensing Model CTF878 Clamp On Tag Flowmeter Programming Manual ...
Page 2: ...GE Sensing Model CTF878 Clamp On Tag Flowmeter Programming Manual 910 254PA4 February 2009 ...
Page 7: ...Chapter 1 ...
Page 47: ...Chapter 2 ...
Page 59: ...Chapter 3 ...
Page 60: ...Creating and Managing Sites Introduction 3 1 Site Manager 3 2 ...
Page 73: ...Chapter 4 ...
Page 89: ...Chapter 5 ...


