RECORDINGS SELECTION SCREEN:
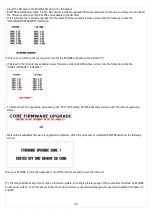
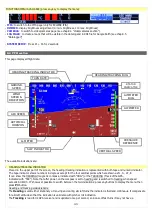
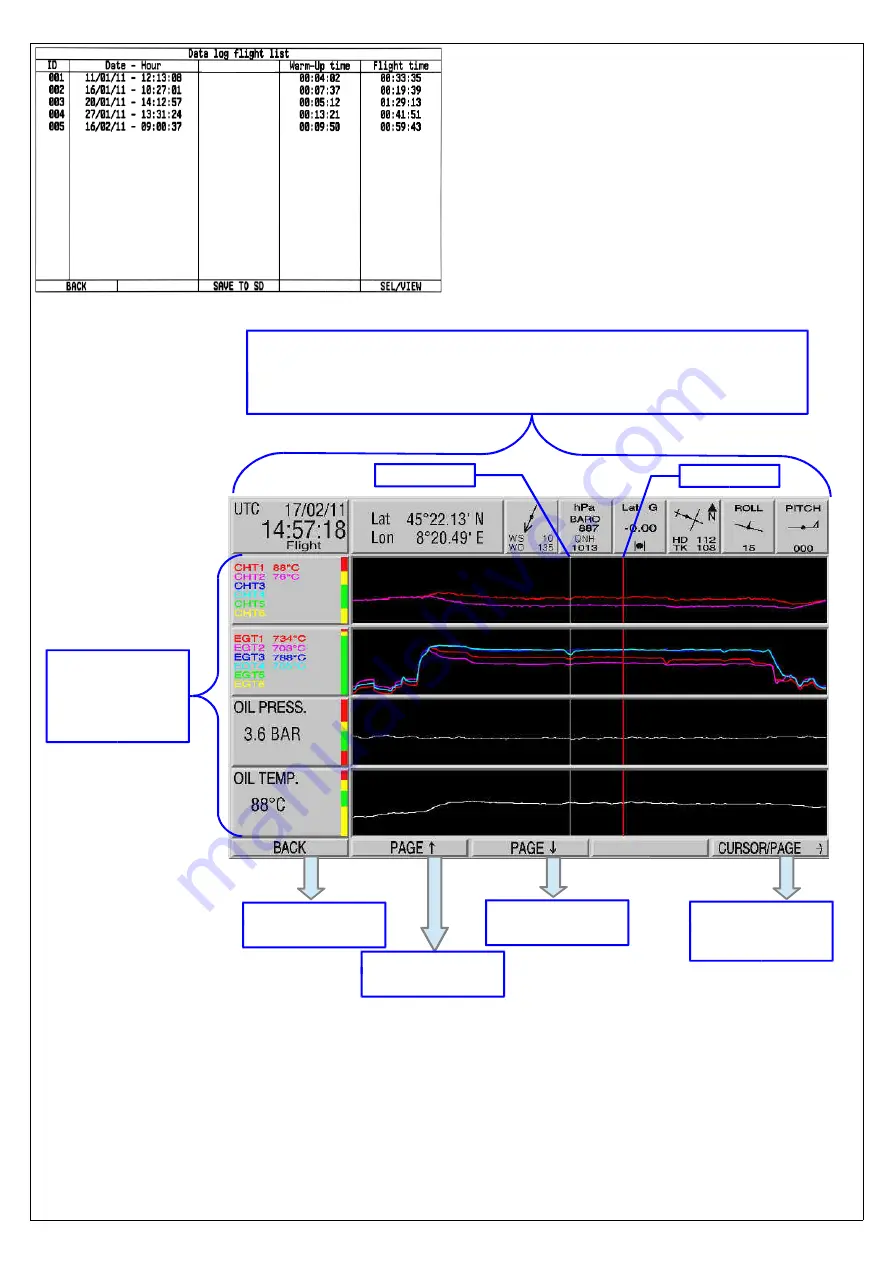
In this screen there is the complete lists of all the
recordings made. Recordings are identified by the “ID”
sequential number on the first column. The second
column shows date and time of start recording
(informations read from the GPS). To know the effective flight
time read the last column. Note that Eclipse create a new
recording every time the engine is turned on (or, for PFD
version, airspeed exceed 30 km/h); in the “Warm-up time”
column is shown the time spent for the engine warm-up.
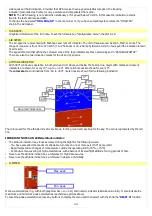
Rotate the knob to select a recording and press it to
switch to the recording analysis screen (see next image).
Press
P3
button (Save to SD) to download the selected
recording in the SD card, press
P1
button (BACK) to switch
back to previous menu.
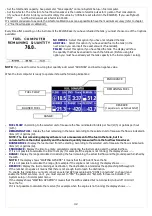
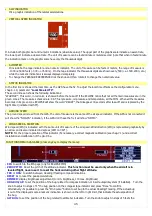
The cursor permits to analyze the flight throughout its duration. All numerical values are relative to the actual position of the
cursor (rotate the knob to move the cursor).
The “Mark” is a graphical reference that can be used during the flight to store a particular moment that can be easily find out on
the graphic (it will be stored also on the .KML file for Google Earth). To store a new mark during a flight, select the “Log Mark”
item from the menu bar.
Graphics are available for all data measured by the ECLIPSE, so depending on the version and assuming you installed all the
48
Graphics and
numerics data
(4 graphics per
page, divided in
more pages)
Fixed numerical data, from left to right:
Date and time (from GPS), coordinates (from GPS), wind speed and
direction, barometer with pressure reference set, lateral acceleration with
slip indicator, heading and tracking, roll and pitch
Switch back to
previous menu
(P1 button)
Page up for previous
graphics
(P2 button)
Page down for next
graphics
(P3 button)
Rotate the knob to
move the cursor or
press and rotate for
fast forward
Cursor
Mark
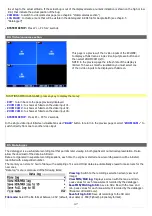
Summary of Contents for Eclipse
Page 6: ...ECLIPSE PART I INSTALLATION 6 ...
Page 7: ...2 Dimensions 7 ...


