QuadroFXO Manual II: Administrator's Guide
Quadro's Graphical Interface
QuadroFXO; SW Version 5.1.x
28
Call Bandwidth Statistics
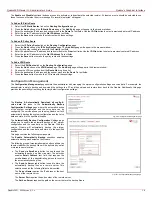
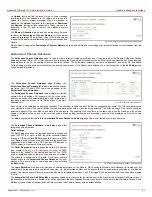
Call Bandwidth Statistics page allows you to see the bandwidth
used at the moment of maximum incoming and outgoing call traffic
for the certain time frame. It will give you an idea whether the
upload and download bandwidth configured from
is enough or some calls will be denied in a
high load periods.
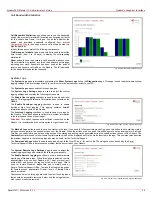
Initially, this page consists of the following components:
Traffic range of statistic table drop down list is used to select the
time interval (from 1 to 90 days) to display the corresponding
statistics for.
Show button is used to generate a call bandwidth statistics chart.
When this button is pressed, a colored chart appears on this page
indicating how much bandwidth has been used at the peak of
receive and transmit call traffic on the Quadro. The K letter used
for the bandwidth indicates the thousand.
Fig. II-48: Call Bandwidth Statistics page
System Logs
The System Logs page is accessible by pressing the Show System Logs link on the Diagnostics page. This page is used to adjust where system
logging settings, view system logs directly in your browser or download them locally to your PC.
The System Logs page consists of three sub-pages.
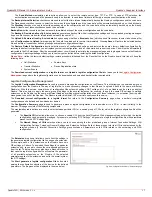
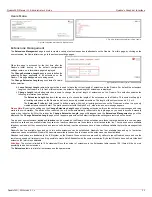
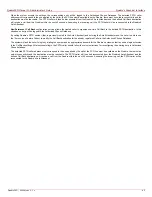
The System Logs Settings page is used to adjust the system
logging settings and contains the following components.
The Enable User Logging checkbox is used to enable user level
logging. This logging contains brief information about events on the
Quadro.
The Enable Developer Logging checkbox is used to enable
developer high level logging. This logging contains detailed
information about events on the Quadro.
The Archived Logging checkbox is used to keep more logs on
the Quadro. This option allows to collect more system information
in the log files and to keep them longer.
Attention:
This option requires quite sufficient resources on the
Quadro. It is recommended to use this option in urgent cases only.
Fig. II-49: System Logs - System Logs Settings page
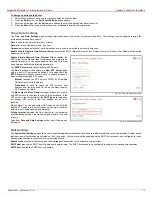
The Mark all Logs button is used to set a line marker in the logs. If you need to follow a certain piece of log, push this button to set a starting mark in
all logs and then perform the needed actions over the Quadro. When the actions are done, push this button again to set an ending mark in all logs.
This way you shall clearly see a piece of log between the staring and ending marks generated during the certain actions taken over the Quadro. The
Comment text field is used to insert some text information which will be displayed next to the marks inserted in the logs. This comment may describe
the problem captured in the following logs and may be useful for the Technical Support.
The Download all Logs button is used to download all logs to the local PC as a *.tar archive file. These logs can then be used by the Epygi
Technical Support Office to determine the problem that has occurred on your Quadro.
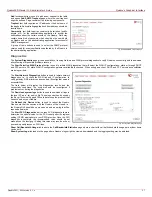
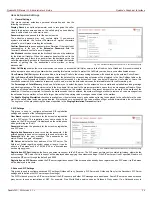
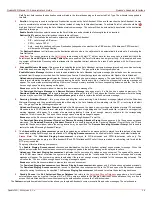
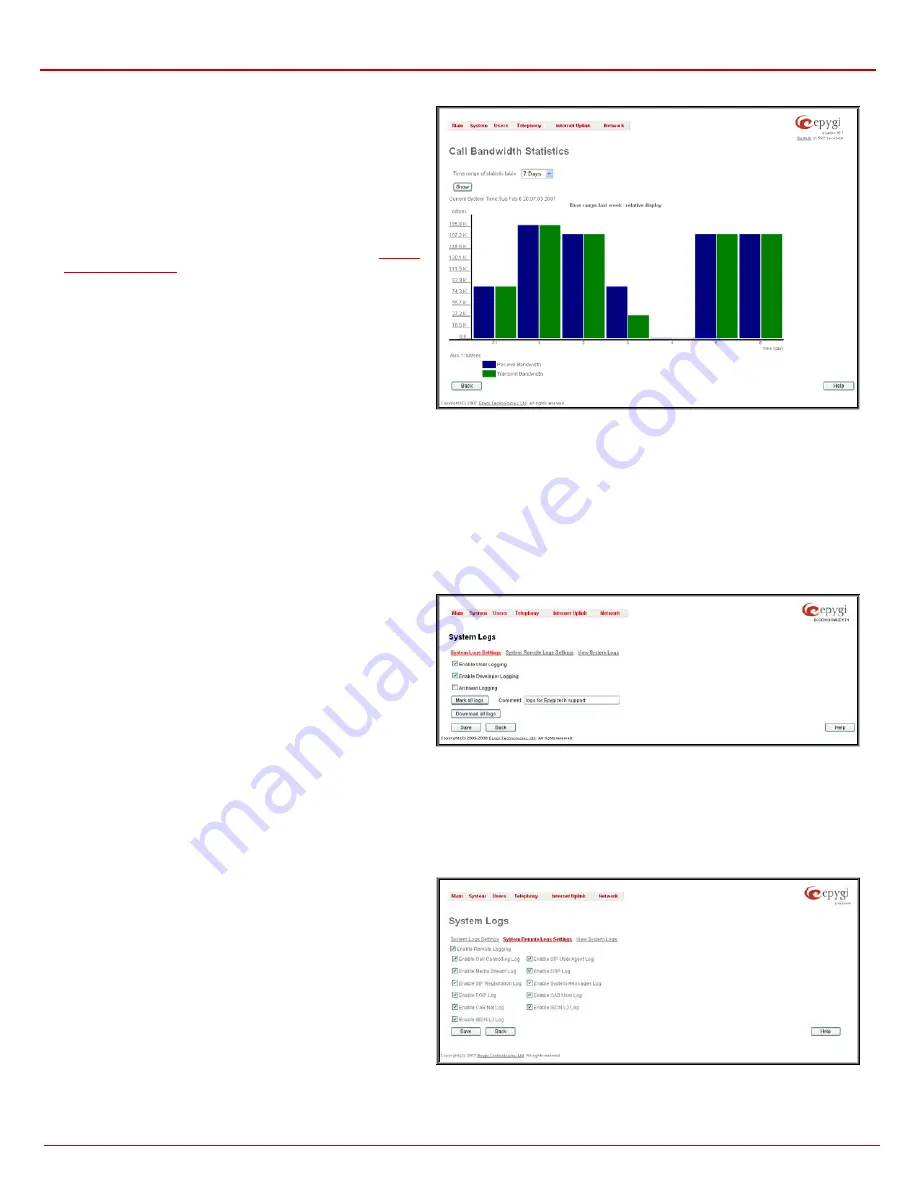
The System Remote Logs Settings page is used to adjust the
system logging settings and contains the following components.
The Enable Remote Logging checkbox is used to enable remote
monitoring of Quadro’s logs. When this option is selected, remote
administrators may connect Quadro with Telnet protocol (port
number 645) and access the logs selected on this page. This is
done for remote Quadro’s diagnostics and is mainly used by
Epygi’s Technical Support Office. To make the Quadro’s logs open
for remote access, appropriate Firewall level or Filtering Rules
must be created.
Checkboxes below on this page are used to select those log types
that should be accessible remotely. Select only those logs that you
wish to have monitored remotely.
Fig. II-50: System Logs - System Remote Logs Settings page


