Diagnostics and troubleshooting
Liquistation CSF39
142
Hauser
You can also adapt the display to suit your individual requirements:
• Press the navigator button in the graphic display: you are given additional options such
as the zoom function and x/y movement of the graph.
• Define the cursor: if you select this option, you can move along the graph with the
navigator and view the logbook entry (data stamp/measured value) in text form for
every point in the graph.
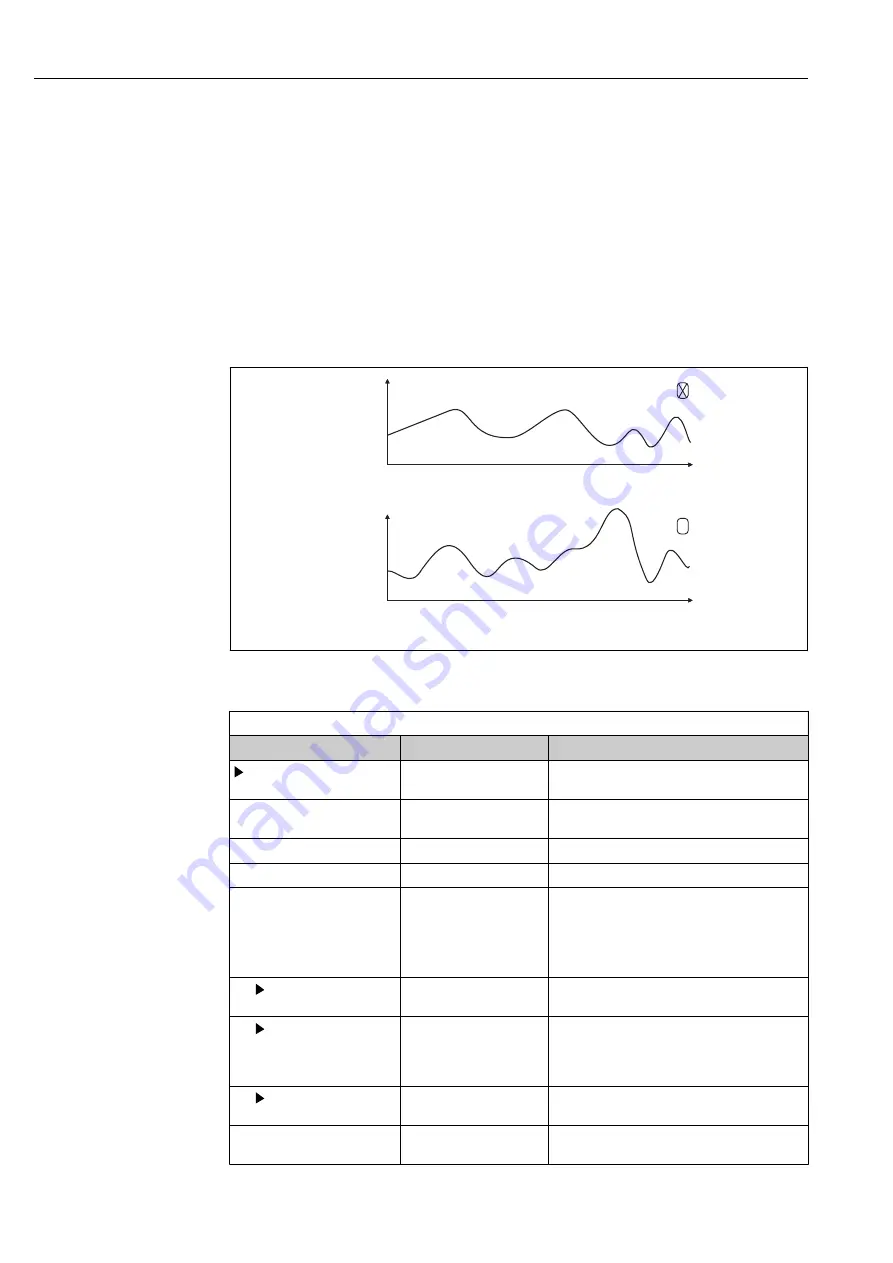
• Simultaneous display of two logbooks:
Select 2nd plot
and
Show plot
• A small cross marks the currently selected graph for which the zoom can be changed
or a cursor used, for example.
• In the context menu (press the navigator button), you can select the other graph. You
can then apply the zoom function, a movement or a cursor to this graph.
• Using the context menu, you can also select both graphs simultaneously. This enables
you to use the zoom function on both graphs simultaneously, for example .
126.00
nA
34.00
nA
09.11.2011
14:02:20
23.11.2011
11:25:32
126.00
nA
34.00
nA
09.11.2011
14:02:20
23.11.2011
11:25:32
6.00
pH
09.11.2011
14:02:20
23.11.2011
11:25:32
09.11.2011
14:02:20
23.11.2011
11:25:32
12.00
pH
A0016688
61
Simultaneous display of two graphs, the top one is "selected"
DIAG/Logbooks
Function
Options
Info
Data logbooks
Chronological list of the data logbook entries for
sensors
Data logbook 1 ... 8
<Logbook name>
This submenu is available for each data logbook
that you have set up and activated.
Source of data
Read only
Input or mathematical function is displayed
Measured value
Read only
Measured value being recorded is displayed
Log time left
Read only
Display of days, hours and minutes until logbook
is full.
‣
Pay attention to the information on
selecting the memory type in the
General
settings
/
Logbooks
menu.
Show
Events are displayed
Select a particular event to display more detailed
information.
Go to date
User entry
• Go to date
• Time
Use this function to go directly to a specific time
in the list. In this way, you avoid having to scroll
through all the information. The complete list is
always visible, however.
Show plot
Graphic display of the
logbook entries
The entries are displayed according to your
settings in the
General settings
/
Logbooks
.
Select 2nd plot
Select another data
logbook
You can view a second logbook at the same time
as the current one.
Summary of Contents for Liquistation CSF39
Page 2: ......
Page 188: ...www addresses endress com ...


