43
6.6.4
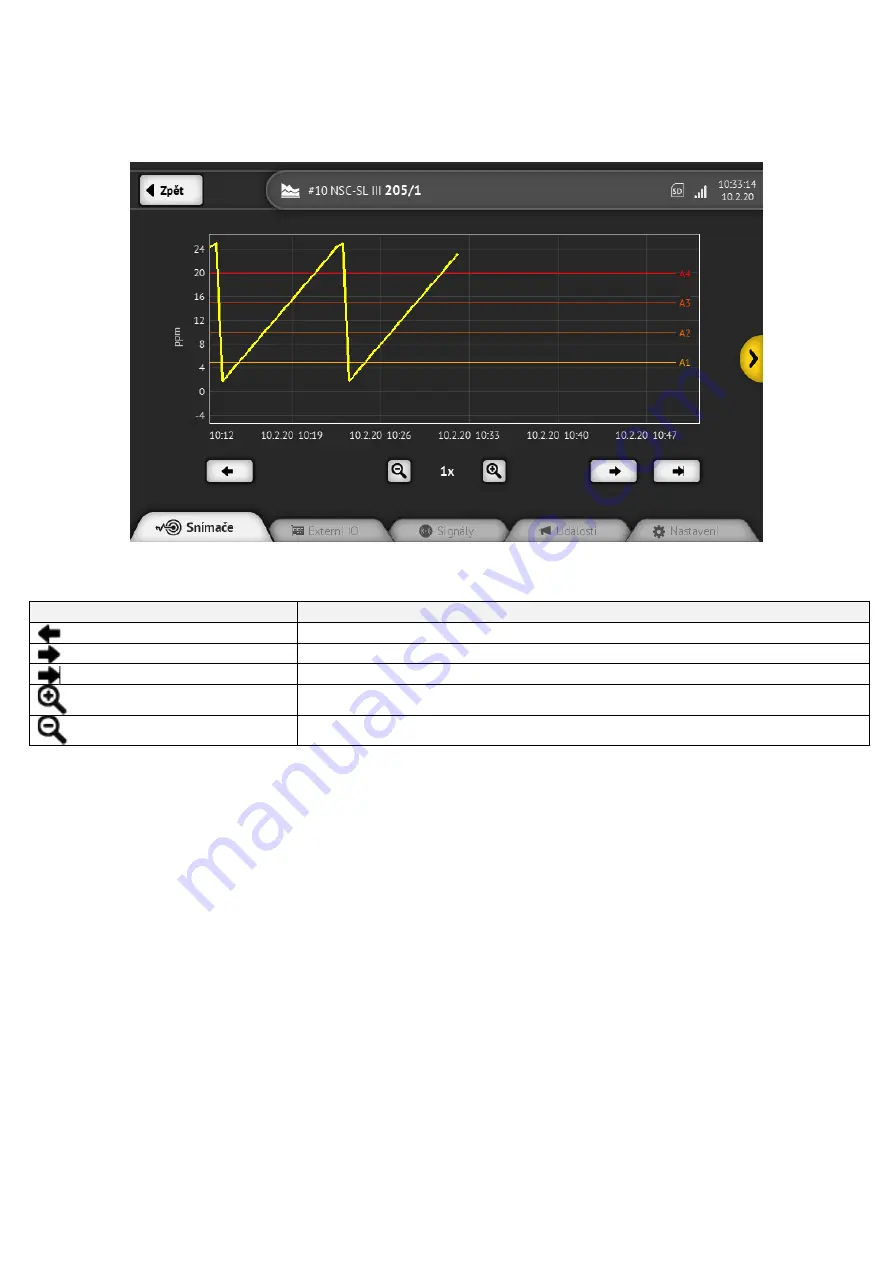
Channel value history screen
The dialog is used for graphical display of the history of channel values. The X axis of the graph represents the sampling time of
the value and the Y axis the value of the channel. The range of the Y axis is given by the channel 'offset' parameter (lower limit,
usually 0) and the ALARM4 value (upper limit). If channel data is not available for a certain time (a sensor failure or the control
panel was out of order), the graph is not plotted at that location.
Figure 30 Channel value history screen
Dialog item
Description
Move the graph to the past
Move the graph towards the present
Reset the timeline to the current time
Timeline scaling - zoom
Timeline scaling - reduction
Table 13 Channel value history dialog
Tip: you can use the 'swipe' gesture to the right or left in the graph area to move the graph.


