MVE Biological Systems
TEC 3000 Operating and Maintenance Freezer Manual
13289499 Rev H •
95
Plotting the Event Log
1. Open downloaded event log with EXCEL
2. Before plotting be sure to delete any rows containing text; such as,
“Parameter
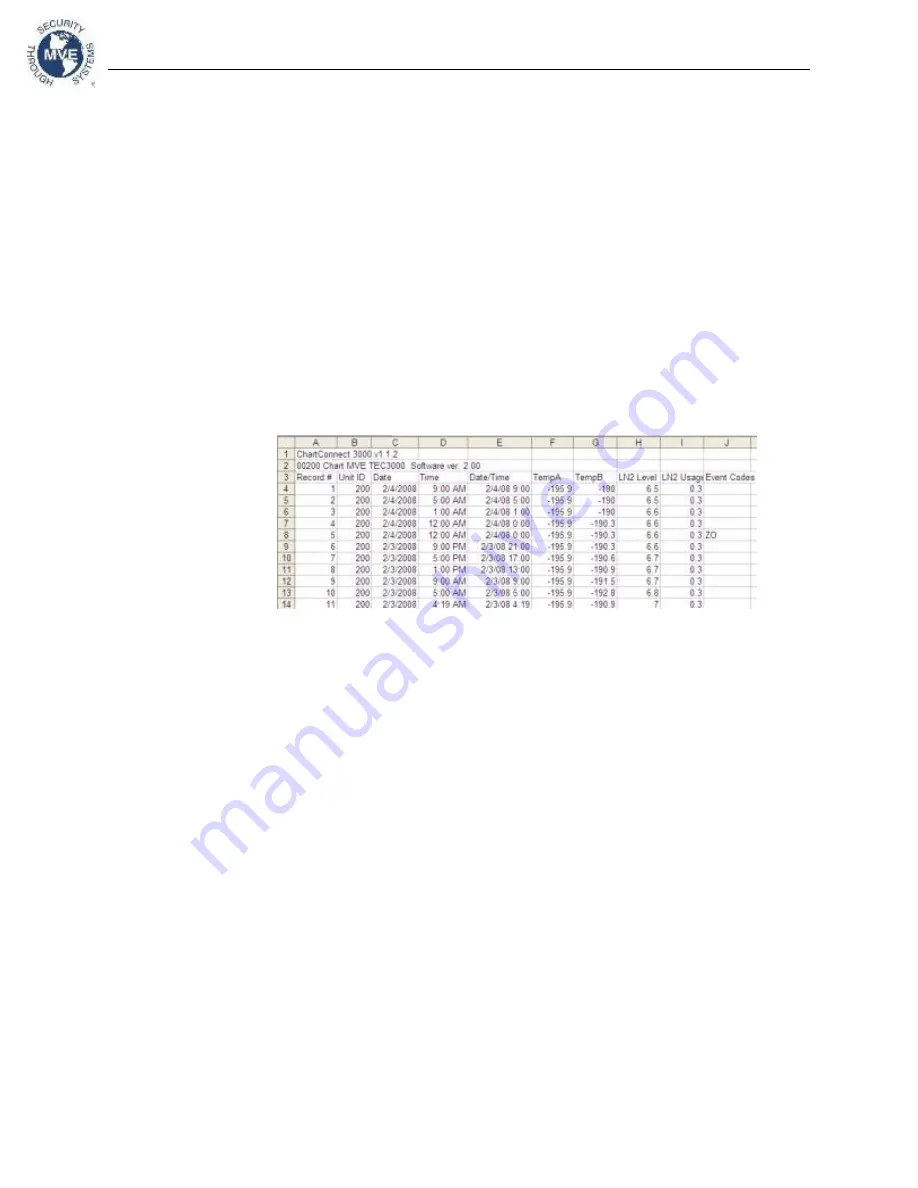
number…” refer to figure 15 for clean data
3. Insert new column between the Time and Temp A columns
4. Label this new column heading Date/Time
5. In cell E4, enter the formula
“=C4+D4”
6. Fill down the rest of column E with this formula
7. Format the cells in column E so that the Number Category is Date and the Type is
a date/time combination
8. Sort all the data by Descending Date, then by Descending Time, and then by
Ascending Record #
9. Select the desired data to plot (Date/Time through LN2 Usage columns) and insert
a scatter chart.
10. Once the chart has been created, select a secondary axis for the LN2 Level and
LN2 Usage data sets
11. Format the chart and adjust the axis scales so that the data is easy to view and
analyze.
Figure 15:
Properly formatted event log for plotting


