21
ENG
"humiFog direct" +0300073EN rel. 1.4 - 29.03.2022
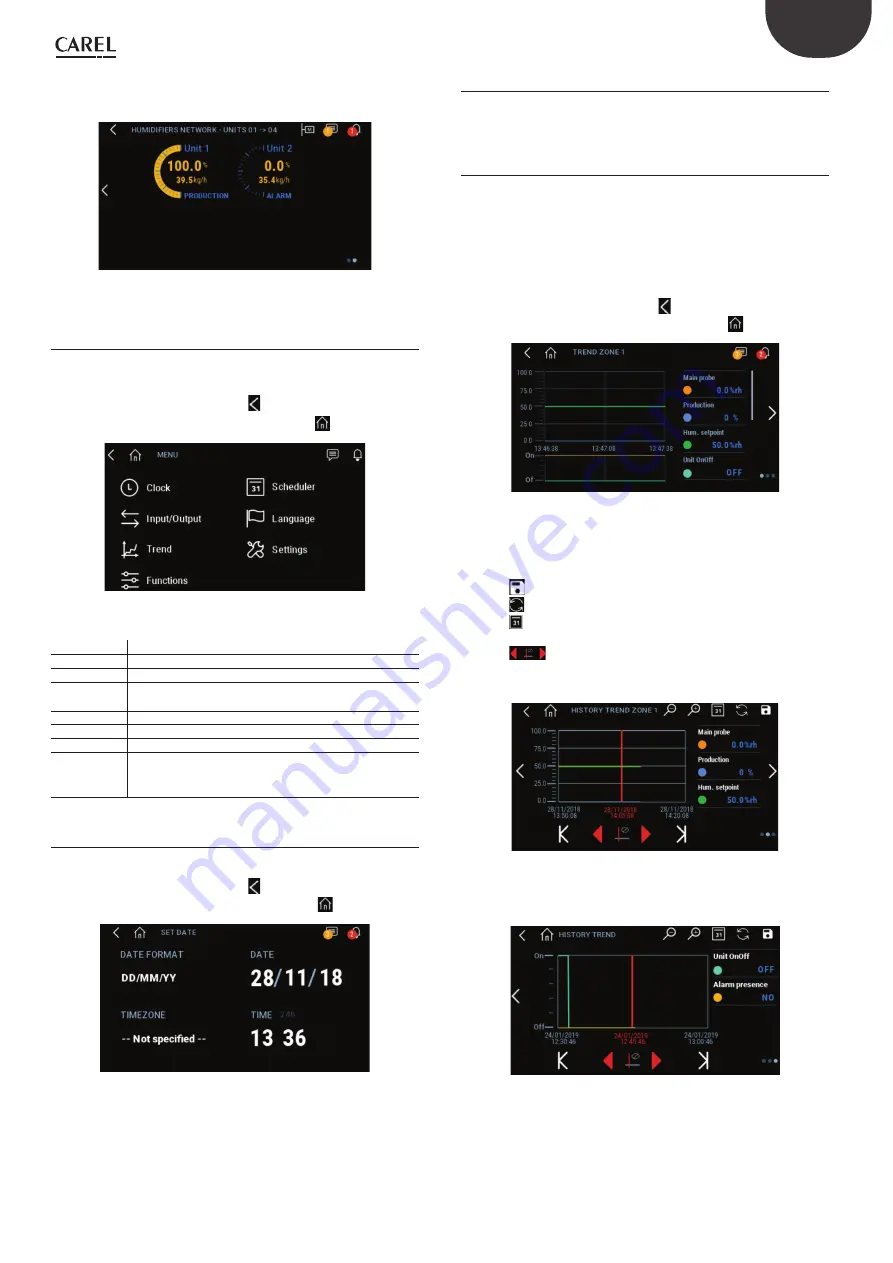
To view the page with details on current production and the status of the
humidifi ers in the Main/Secondary network, press the right arrow.
Fig. 7.o
To access information on the individual humidifi er, press the desired unit.
7.3.11 Main
menu
Press the icon to access the main menu.
The menu provides access to the system items that are available without
entering a password.
To return to the previous display, press
To return to the home menu, press the “HOME” icon
Fig. 7.p
Description of the menus:
Menu
Description
Clock
Date and time setting
Input/Output Display the analogue and digital inputs/outputs
Graphs
Display historical and real-time operation of the
humidifi er
Functions
Special and manual functions
Scheduler
Manage scheduling of working time bands
Language
Set the menu language
Settings
Access advanced humidifi
er confi
guration (Installer
password 77). Menu: E. Settings. Change unit of measure
(Imperial/International)
Tab. 7.e
7.3.12 Clock
Press the icon to access the function.
Press the text to change the desired parameters.
To return to the previous display, press
To return to the home menu, press the “HOME” icon
Fig. 7.q
7.3.13 Input/Output
Press the icon to access the function.
The same screen is displayed, which is also accessible from the input/
output quick menu.
7.3.14 Graphs
Press the icon to access the function.
The graphs function is used to view the values of some system analogue
and digital variables over a certain time frame.
Press the zone to be viewed.
On the fi rst screen displayed, the real-time value of the analogue and
digital variables relating to the zone is plotted. The value of each variable
is shown numerically in the table to the right of the graphs.
To scroll through the displayed information, press the slider.
To return to the previous display, press
To return to the home menu, press the “HOME” icon
Fig. 7.r
To move from one page to another, press the arrows on the right and left
of the display.
Moving to the right, the second screen displays the history of analogue
variables for the zone.
Press the
icon to save the graph displayed to external memory.
Press the
icon to restore the initial view.
Press the
icon to select the length of the period to be viewed.
Press the arrows under the graph to change the period displayed.
Press the
icon to hide the variables, magnify the graph and move
the red cursor. The value of the variables corresponding to the red cursor
is shown in the table on the right.
Fig. 7.s
Moving to the right again, the history of the system's digital variables is
displayed on the third screen.
Fig. 7.t
Summary of Contents for DLAQ2DF100
Page 1: ...NO POWER SIGNAL CABLES TOGETHER READ CAREFULLY IN THE TEXT humiFog direct User manual...
Page 2: ......
Page 4: ...4 ENG humiFog direct 0300073EN rel 1 4 29 03 2022...
Page 42: ...42 ENG humiFog direct 0300073EN rel 1 4 29 03 2022 14 2 Two zone wiring diagram GA1 Fig 14 b...
Page 46: ......
Page 47: ......


