


SECTION 5: WEATHER
®
making
since 1986
water work
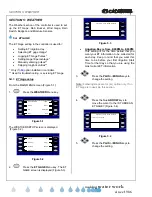
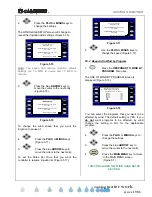
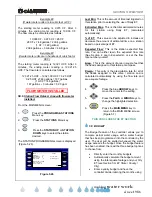
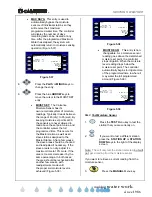
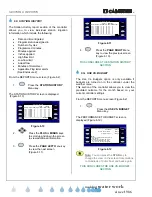
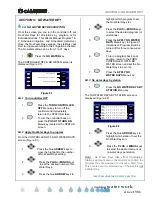
The MANUAL IRRIGATION screen (Figure 5.40).
MANUAL MENU
Manual Watering Manual Program 1
Test Manual Program 2
Learn Expected Use Hold - Over
MV Override Walk - Thru
Figure 5.40
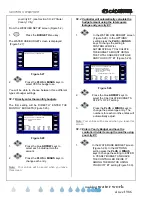
4.
Press the
TEST
Menu key.
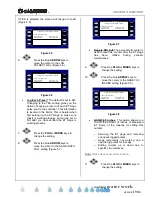
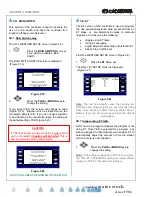
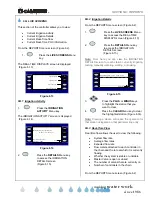
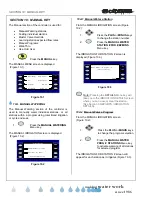
The VALVE TESTING screen is displayed
(Figure 5.41).
Test Station 1 for 2.0 minutes
VALVE TESTING
Learn the Expected at Station 1
0 GPM 0.00 AMPS
Test Station 1 for Moisture Sensor
(MASTER)
Figure 5.41
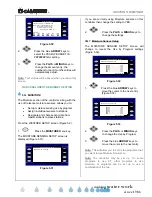
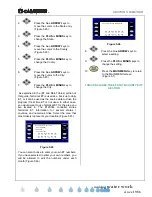
5.
Press the blue
ARROW
keys to
move the cursor to the
TEST
STATION # FOR MOISTURE
SENSOR
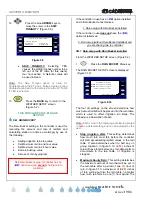
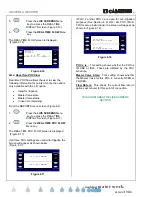
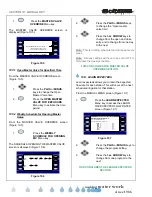
Entry (Figure 5.42).
Test Station 1 for 2.0 minutes
Test Station 1 for Moisture Sensor Walk - Thru
VALVE TESTING
Learn the Expected at Station 1
0 GPM 0.00 AMPS
(MASTER)
Figure 5.42
6.
Press the
PLUS
or
MINUS
key to
change the station entry.
Note:
Only Master stations can test Moisture sensor
for readings.
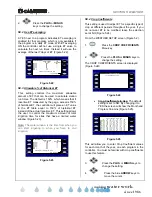
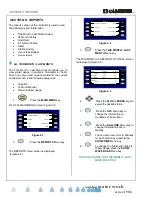
7.
Press the
TEST STATION # FOR
MOISTURE SENSOR
Menu key to
activate test. The screen will show
“READING SENSOR ON # please
wait (Less than 15 seconds)” for
which ever station you selected.
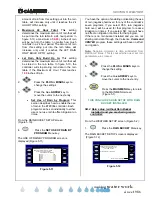
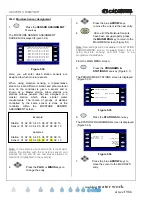
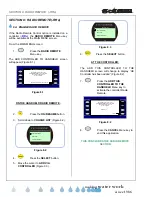
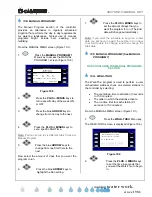
After a brief test the STATION
PROGRAMMING screen will appear
with the Moisture Sensor reading
displayed (Figure 5.43).
Max Days: 00
Moist Set: 99
Moist Read: 45
STATION PROGRAMMING
Station 1 . . . . . . . . . . . . . . . . . . . . . . . PROG A
Total Mins : 15.0
Mins per Cycle : 5
Soak - In Time : 60 No Water Days 0
Test
0 GPM 0.00 AMPS
MASTER
Figure 5.43
THIS CONCLUDES THE MOISTURE
SECTION
5H. ET STATE / COUNTY / CITY
This section of the controller is only available if using
budgets, or daily ET by program, and is used for:
•
Selecting pre-programmed State,
County & City monthly ET values.
•
Setting your own State, County &
City monthly ET values.
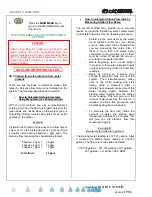
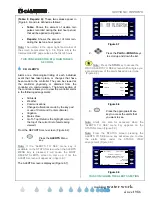
5H.1 ET State/County/City setup
From the WEATHER SETUP screen (Figure 5.2).
1.
Press the
ET STATE/COUNTY/
CITY
Menu key.
The REFERENCE ET NUMBERS screen is
displayed (Figure 5.44).
Source: Supplied ET for Your City
REFERENCE ET NUMBERS
State: CALIFORNIA
City: CHINA LAKE
County: KERN
JUL AUG SEP OCT NOV DEC
11.0 9.8 7.3 4.9 2.7 1.7
JAN FEB MAR APR MAY JUN
2.1 3.2 5.3 7.7 9.1 10.0
Figure 5.44


