4-12
User’s Guide
Viewing Server Hardware Status
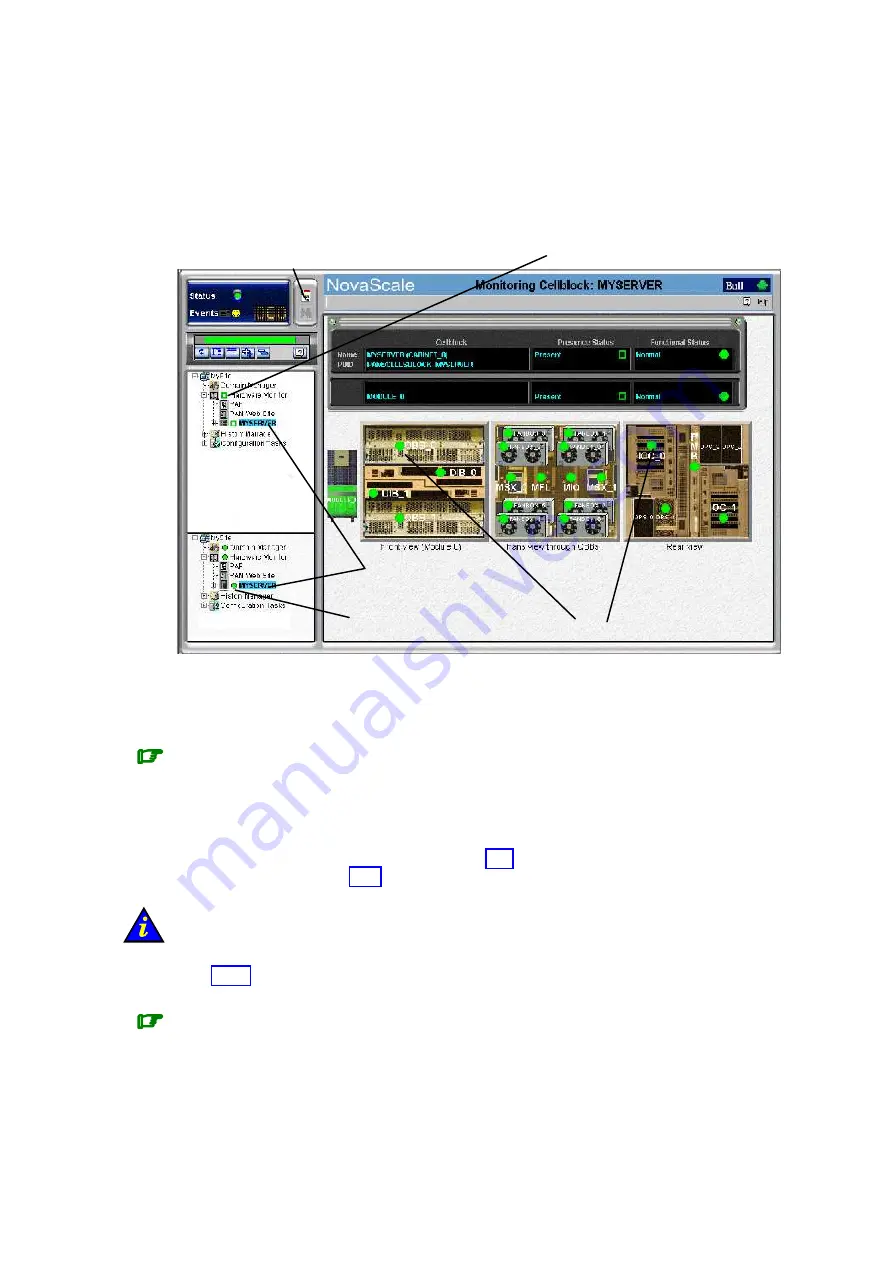
When you click the
CSS Name
in the PAM tree (e.g.
MYSERVER
in the figure), the
Hardware Monitor
displays a visual representation of the presence and functional status of
CSS module components in the Control pane. Each primary hardware element functional
status indicator is a clickable hotspot leading directly to the detailed
Hardware Status
page.
Clickable hotspots
Functional Status
(after toggle)
CSS Name
Presence Status
(default display)
Presence/Functional
Status Tree Toggle
Figure 77.
PAM Hardware Monitor
As you click a hardware element hotspot in the Control pane, you will notice that the PAM
Tree automatically expands to the selected component level.
Note:
If a component is not part of your configuration, it is grayed out in the display.
If a component is part of your configuration but has been detected as “missing”, it is
displayed in red.
The meanings of presence and functional status indicators are explained in Table 19.
Hardware Presence Status Indicators
, on page 4-6 and Table 20.
Hardware Functional
Status Indicator
Important:
If a functional status indicator is not green, see
What to Do if an Incident Occurs
, on
Note:
The NovaScale 6165 Server Hardware Monitor Control pane displays a visual
representation of the presence and functional status of the components of both CSS
modules.
Summary of Contents for NovaScale 5 5 Series
Page 1: ...Bull NovaScale 5xx5 6xx5 User s Guide 86 A1 41EM 00 ORDER REFERENCE...
Page 2: ......
Page 52: ...1 24 User s Guide...
Page 76: ...2 24 User s Guide...
Page 168: ...5 2 User s Guide...
Page 288: ...User s Guide A 10...
Page 300: ...B 12 User s Guide NovaScale 5165 Server Data Cabling Diagrams Internal Disk Configuration...
Page 304: ...B 16 User s Guide NovaScale 6165 Server Data Cabling Diagrams Internal Disk Configuration...
Page 362: ...C 48 User s Guide...
Page 372: ...User s Guide G 10...
Page 378: ...User s Guide X 6...
Page 381: ......
Page 384: ......


