


411829-L, Operation
April 2012
Page 4-30
4
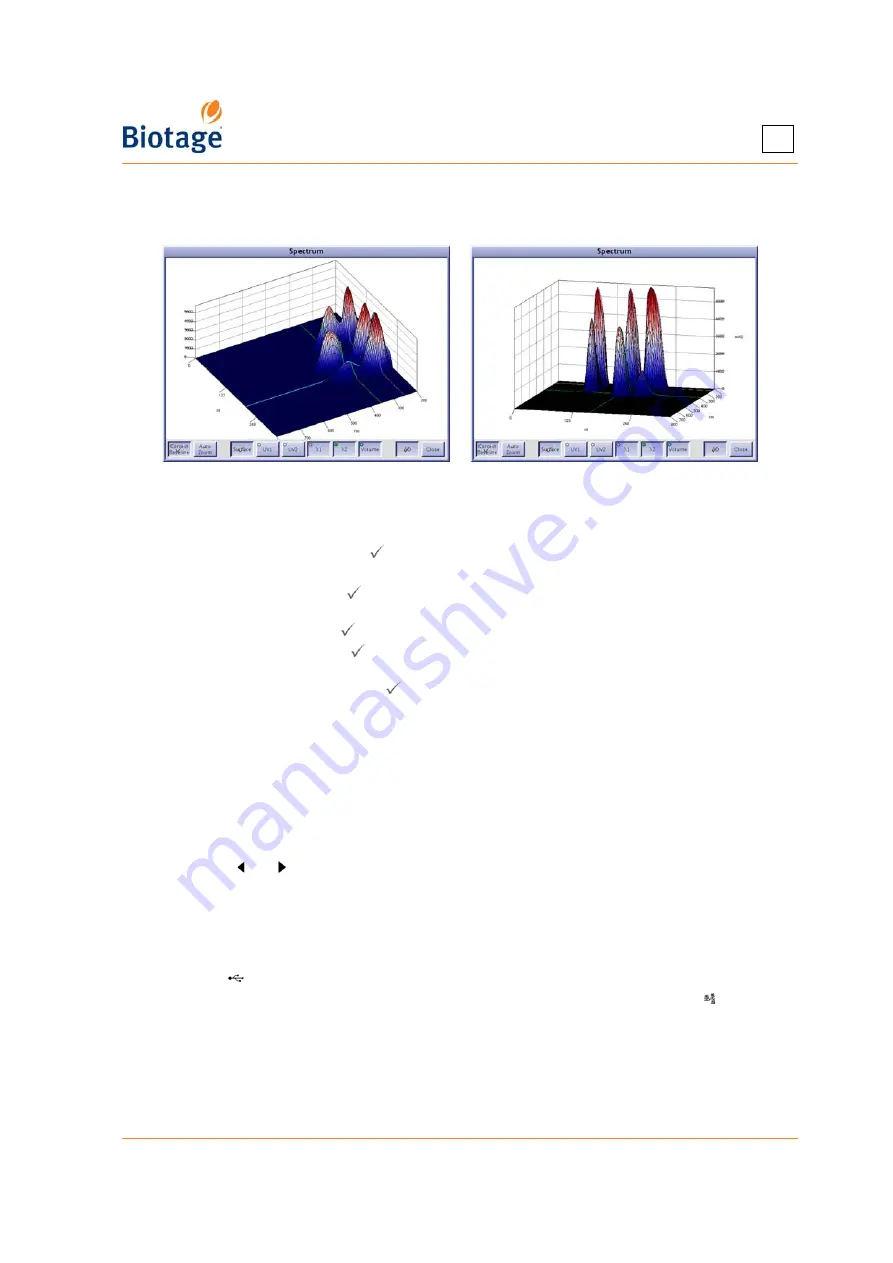
c. To show a 3D absorbance spectrum instead, press 3D. Drag the 3D spectrum to change
the perspective, see the examples below in Figure 4-24. Note that the way it looks here is
the way it will look in the archive report.
Figure 4-24. 3D Absorbance Spectrum in Different Perspectives
4. To modify the fraction and archive reports, select the
Report Setup
tab. The following buttons
can be used to modify the reports:
•
Gradient:
When enabled ( ), the programmed gradient is shown in the chromatogram.
•
Reset Zoom:
Reset the zoom to default.
•
Zoom:
When enabled ( ), you can select a region of the chromatogram to magnify
(zoom in). This is useful when the chromatogram displays many fractions close together.
•
Drag:
When enabled ( ), you can drag the chromatogram to the desired position.
•
Select:
When enabled ( ), you can select and deselect fractions in the chromatogram.
(Fractions can at any time be selected and deselected in the tray overview.)
•
Peak Mode:
When enabled ( ), you can select a peak by selecting one of its fractions.
All fractions of a peak have the same color.
•
Select All:
Select all fractions.
•
Deselect All:
Deselect all fractions.
•
λ
...:
Modify how the 3D absorbance spectrum is presented in the archive report. See step 3
above.
•
Length Unit:
Change the horizontal axis (the x-axis) unit by pressing the button
repeatedly until the desired unit appears; CV, minutes, or milliliter.
If there was one or more rack changes during the run, or the run was performed on a system
with two collection trays with allocated racks on both trays, toggle between the racks by
pressing the and buttons.
5. To print the archive or fraction report to the (local or network) printer connected to the system,
press
at the corresponding tab. (If the button is disabled, no printer has been installed.
See “Set Up a Printer and Auto Print of Reports” on page 3-6.)
6. To save the selected report as a PDF file on a USB memory device:
a. Connect
a USB memory device to the USB port located underneath the touch screen.
b. Press
Save
. The report is saved at “USB”:\biotage\isolera\results.
7. To save the selected report as a PDF file in a share folder on your network, press
Save
. The
report is saved at “share folder”\biotage\isolera\results\. (If the button is disabled, no file
sharing has been set up. See “Set Up File Sharing and Auto Save of Reports” on page 3-7.)
Summary of Contents for Isolera Four
Page 1: ...Isolera User Manual...
Page 66: ...411829 L Operation April 2012 Page 4 16 4 Figure 4 10 Tube Connections...
Page 114: ......
Page 115: ......


