11
Installation and Startup
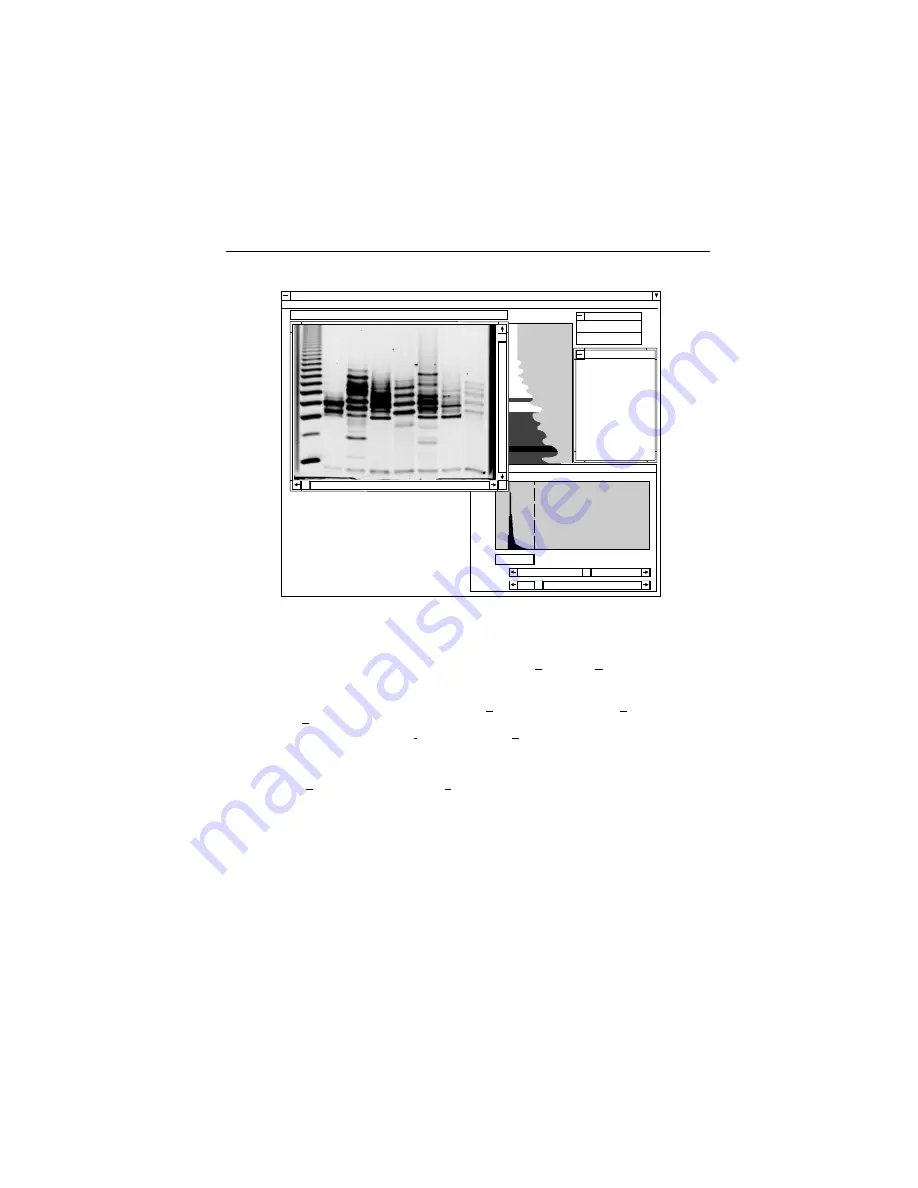
Figure 7. Image Display, Control, and Status Windows
5.
Selectively insert and mark a band or remove a marker from a band of no interest:
•
To remove a band’s marker, click on the + marker and select Delete in the Bands menu.
When you point and click on a marker, it is highlighted in green.
•
To remove the markers from all bands in a selected lane, first select the lane by clicking on its Lane
number. Then, click and drag the mouse to the A Single Lane command in the Delete drop-down
menu of Bands.
•
To insert and mark a band, select Insert Band from the Bands menu. The special cursor allows
you to draw a band outline around the band.
6.
Perform analysis of the Standard Lane.
a.
From the Bands menu, select Standard Lane Analysis and specify the type of gel.
b.
Selecting Oligosaccharides displays the Click on Band window, which instructs you to move the
cursor over the band which marks G4 in the standard lane and click on it. In the Quantification
Value window, enter the number of pMols for the selected band.
Selecting Monosaccharide, Protein, or DNA allows you to specify a standard by selecting from a list
of standards or adding a new standard.
Bio-Rad Glyco Doc Analytical Software
Files
Mouse
Image Histogram
x=200
y=3
Grey=5451
Image
Bands
Options
Window
Zoom
Help
AutoScale
Contrast
0-
Quan
Brightness
Range: 5376 to 18175
1
2
3
4
5
6
7
Summary of Contents for 170-6555
Page 47: ......


