


Allon
®
User Manual
DDT-063-000 Rev C Belmont Medical Technologies Page
99
of
106
Table 15: Zoom Tool Buttons (con’t)
Button
Click to...
How to use...
Zoom in symmetrically in X and
Y directions
Click this zoom tool button. Using the mouse move the cursor
to the Temperature graph; the cursor image changes to the
button icon. Click the mouse to zoom in. You can click again to
zoom in again.
Create an XY zoom in box.
Click this zoom tool button. Using the mouse move the cursor
to the Temperature graph; the cursor image changes to zoom
icon. Press the left mouse button and select the box in the
graph for zooming in. Once you release the mouse button the
image is zoomed in.
Zoom in, in the X (Time)
direction.
Click this zoom tool button, using the mouse move the Zoom
tool cursor to the required point of time, click to insert the low
limit line, keep the left key pressed and pull horizontally to the
end of the interesting time. Once you release the mouse but-
ton the image is zoomed in.
Zoom in, in the Y (Temperature)
direction.
Use the mouse move the Zoom tool cursor to the lower temp-
erature limit, click to insert the low limit line, keep the left key
pressed and pull vertically.
Release the key to view the temperature graphs zoomed in
the selected vertical area.
1.
To return to full time scale after zoom actions:
1. Click on
.
The graph returns to the full time range, without affecting the
Temperature scale.
NOTE:
To return to the original display click the unzoom button
.
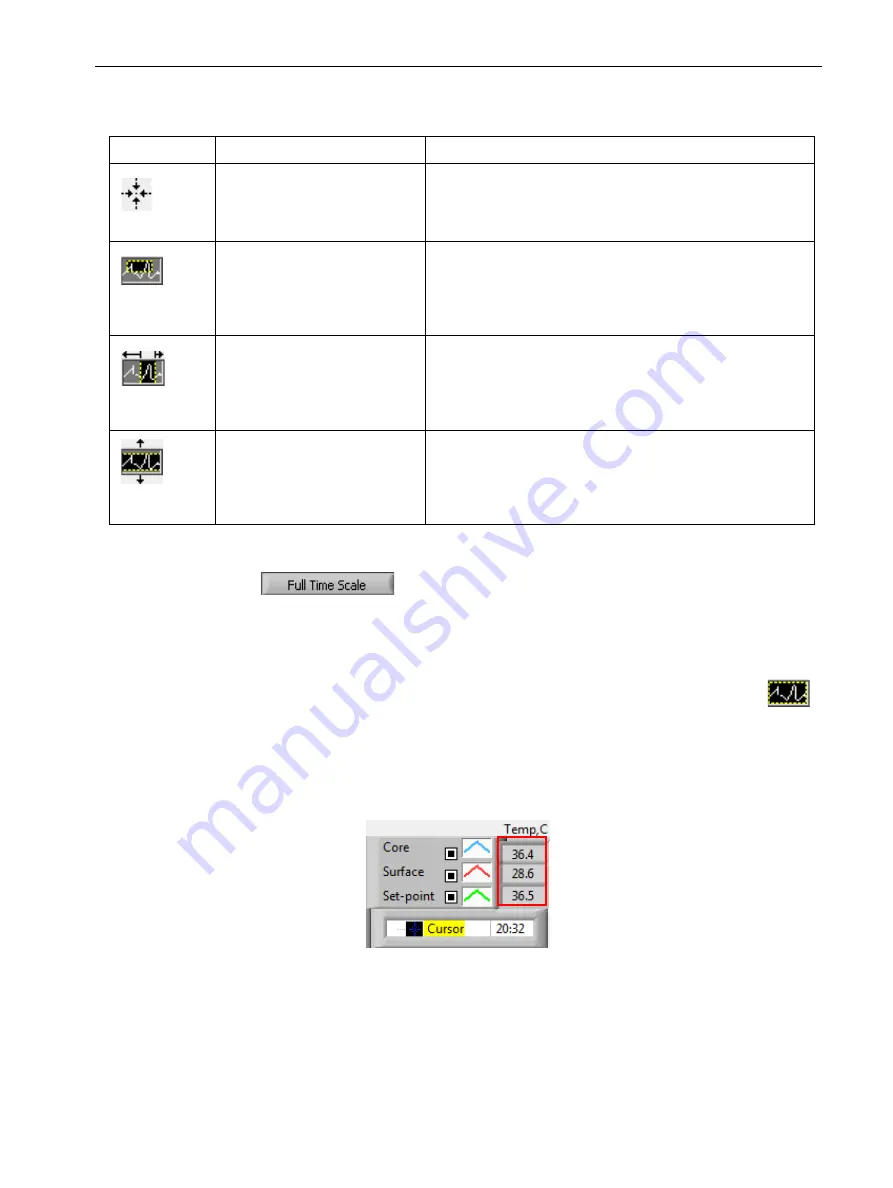
Cursor Line
The values of the temperatures at the cursor line location appear in
the window adjacent to the curve color window (see Figure 47).
You can change the time of the Cursor Line on the graph (see in Figure
1. To set the time of the cursor:
1. Use the keyboard to set the required time in the
Cursor
textbox.
Make sure to select the time as displayed on the graph (and in the


