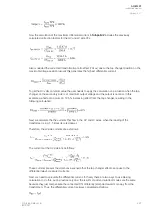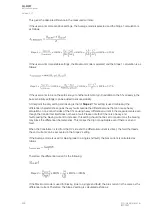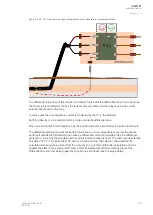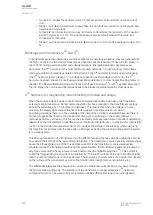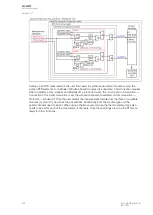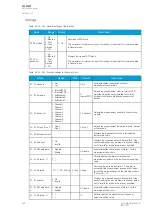
Figure. 5.4.29 - 163. Energizing behavior of a small transformer.
The figure above presents the energizing behavior of a small transformer. The first graph depicts the
applied voltage, the second graph depicts the phase currents' peak and FFT values (as mentioned
earlier, the calculated FFT value is about 50% of the peak value), the third graph depicts the 2
nd
harmonic absolute values (in amperes), the fourth graph depicts the fundamental (50 Hz) FFT-
calculated currents (in amperes), and fifth graph depicts the 2
nd
harmonic components relative to the
corresponding fundamental component currents (with the 15 % setting limit).
A
AQ
Q-M257
-M257
Instruction manual
Version: 2.07
© Arcteq Relays Ltd
IM00021
309
Summary of Contents for AQ-M257
Page 1: ...AQ M257 Motor protection IED Instruction manual...
Page 2: ......


