USE OM - JANUARY 2017
27
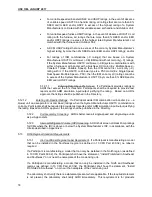
Figure B2: Typical Condenser Capacity Curve
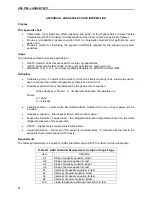
Figure B3: Typical Condenser Power Curves
Typical Condenser Capacity Curve
18000
20000
22000
24000
26000
28000
30000
32000
34000
36000
38000
40
41
42
43
44
45
46
47
48
49
50
51
52
Evaporator Temperature, F
C
o
n
d
e
n
s
e
r
C
a
p
a
c
ity
,
b
tu
h
A-Test
B-Test
HSVTC
HSVTC
Typical Condenser Power Curves
2000
2100
2200
2300
2400
2500
2600
2700
40
41
42
43
44
45
46
47
48
49
50
51
52
Evaporator Temperature, F
C
on
de
ns
e
r
P
ow
e
r,
w
a
tt
s
A-Test
B-Test
HSVTC

