P O Box 159 • Crestwood, KY 40014 • (877) 243-0042 • (502) 243-0039 fax
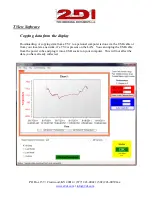
'Hide chart' button will hide the chart and display only the numeric reading. The charts
are updated every few seconds.
(
Note: These temperatures are the actual temperatures taken by the sensor, which
may or may not be the same as the logged temperatures, depending on how you are
averaging data.)
2)
A plot can be removed by clicking on the X in the upper right area of the chart.
3)
If a plot is displayed and an alarm occurs for that sensor, the temperature will turn red
and the alarm status button on the main page will be updated.
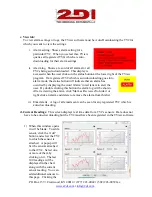
e. Help:
1. 'User guide'.
2. Email Alert Setup. This
word document contains a
step-by-step guide to
implementing the Email
Alert Setup.
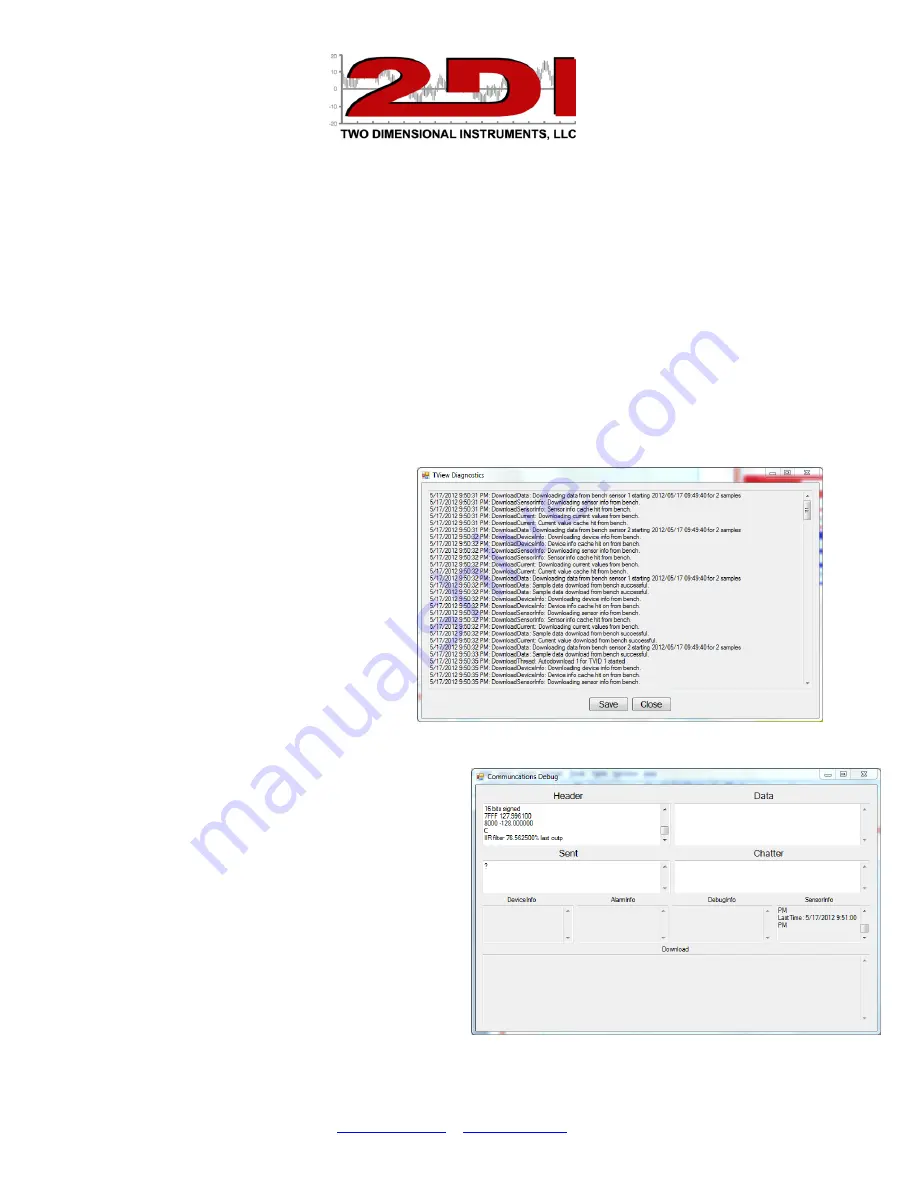
3. 'TView Diagnostics
Menu' will be used when
requested by a 2di
technician. All activity of
the TView software is
archived. This
information can be saved to a file and emailed to 2di.
4. 'TView Communications
Diagnostics' Menu archives all
communications between TView
and TV2s for support and
troubleshooting.
5. 'Save Diagnostics file to send to
2di'. This will save the diagnostic
file to your computer so that it
can be emailed to 2di for help in
troubleshooting.


