P O Box 159 • Crestwood, KY 40014 • (877) 243-0042 • (502) 243-0039 fax
Working with Charts
1.
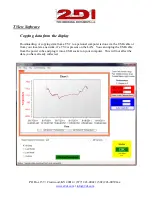
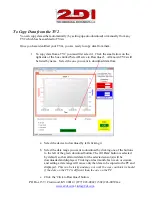
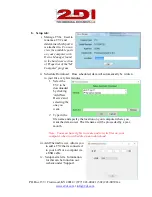
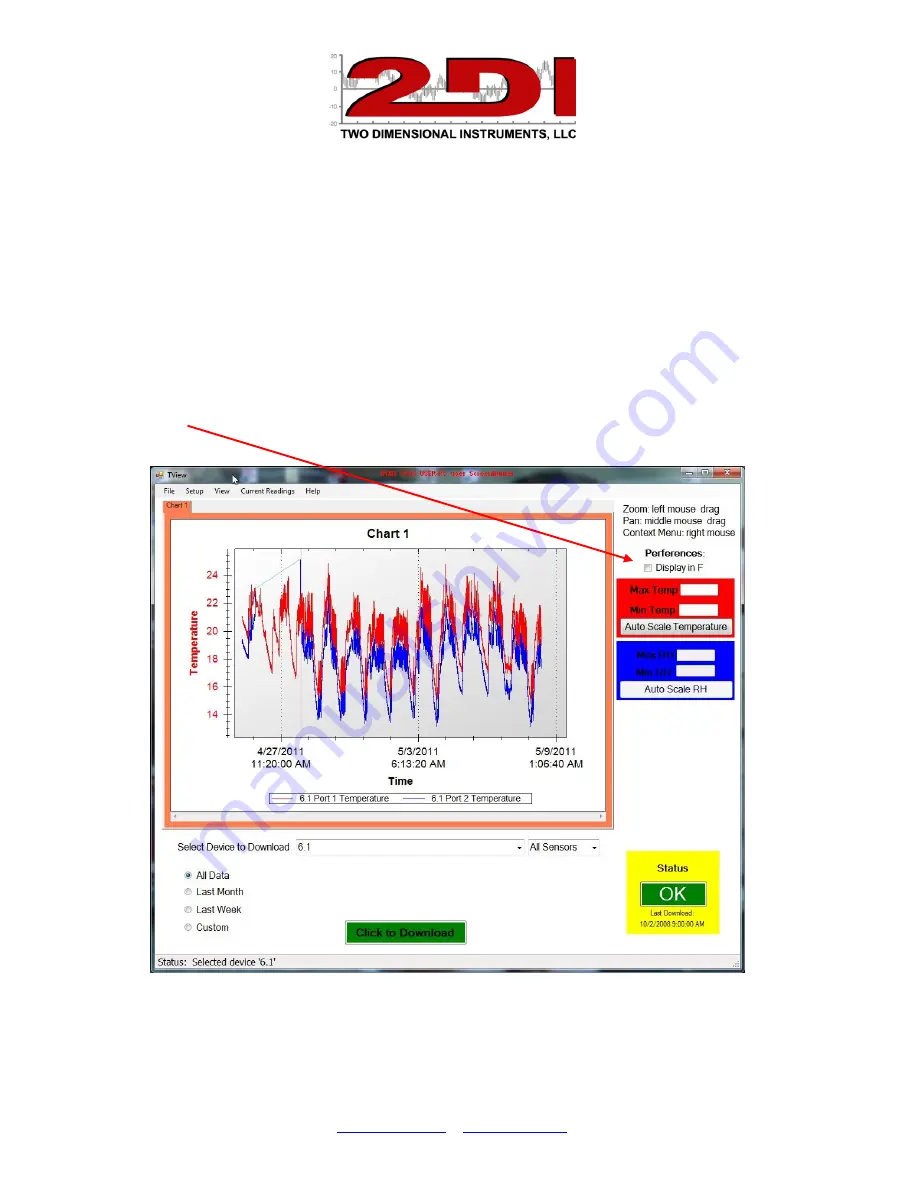
When TView is opened, a blank chart is displayed. It is listed as Chart 1 on the tab at the
top of the chart and as the title of the chart. You can rename this by double-clicking on the
tab and typing a description in the text box. This will rename the chart and the tab.
2.
You can hover over any point of the curve with the mouse cursor to see the value, the date
and the time it was saved.
3.
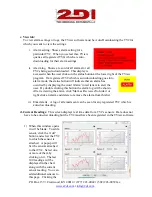
A value scale is on the left of the chart and a RH scale, if humidity has been downloaded, is
the right side of the chart. You can change the temperature scale to Fahrenheit by clicking
the box to the right of the chart under preferences. You can also set the Y-axis for
temperature and humidity by typing a value into the boxes provided.

