


88
2801/2802 Power Analyzer User Guide
Chart Displays
Starting Startup and Inrush Charts
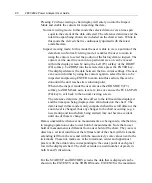
As previously described, the Startup and Inrush charts are initiated by the
detection of an Inrush current and/or the turning on of the internal line switch.
Note that the reported Inrush Numeric Measurement results are the maximal
results collected during the period defined by the Startup chart.
The internal line switch can be disabled or enabled (for either DC or AC
operation) as configured by the user in the MEASUREMENT SETUP menu.
The user can set the Inrush Detection Level in the MEASUREMENT SETUP
menu, or it can be disabled by setting the detection level to zero.
The method used is dependent on the specific configuration chosen by the
user as follows.
Line Switch Disabled and Inrush Detection Disabled
In this case the Startup and Inrush Charts are disabled. Any data previously
captured is maintained in the 2801/2802 as long as power is turned on and the
user does not clear the chart.
Line Switch Disabled and Inrush Detection Enabled
In this case the Startup and Inrush charts are started whenever the actual peak
current waveform changes from having been continuously below the Inrush
Detection Level for at least 20ms to being above the Inrush Detection Level
for at least 4us. This is accomplished in a manner such that the Startup chart
cannot restart mid-way through a data collection (i.e. once the Startup and
Inrush charts have been started they will always run to completion while in
this mode).
Line Switch Enabled and Inrush Detection Disabled
In this case, the Startup and Inrush charts are started concurrently with
the line switch being turned on by the user. If using the Internal Line
Switch (either DC or AC mode), then the charts are started at the time
that the line switch actually turns on. Once started, the user can turn
Содержание Xitron 2801
Страница 1: ...USER GUIDE 2801 2802 Advanced Single and Dual Channel Power Analyzers...
Страница 2: ...2 2801 2802 Power Analyzer User Guide...
Страница 10: ...10 2801 2802 Power Analyzer User Guide...
Страница 19: ...Functional Description 19 Voltage Input Attenuator Figure 2 Voltage Input Attenuator Block Diagram...
Страница 101: ...Printing Results 101 Figure 66 Configuration Printout...
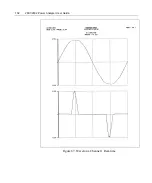
Страница 102: ...102 2801 2802 Power Analyzer User Guide Figure 67 Waveform Channel 1 Real time...
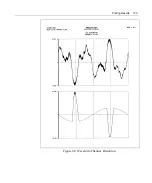
Страница 103: ...Printing Results 103 Figure 68 Waveform Channe1 Distortion...
Страница 104: ...104 2801 2802 Power Analyzer User Guide Figure 69 History Chart VOLTS ACDC Trends View...
Страница 105: ...Printing Results 105 Figure 70 History Chart AMPS PERCENT THD Extents View...
Страница 106: ...106 2801 2802 Power Analyzer User Guide Figure 71 Harmonics Listing page 1...
Страница 107: ...Printing Results 107 Figure 72 Harmonics Listing page 2...
Страница 145: ...Sending Commands and Interrogatives 145...
Страница 147: ...Appendix A Physical Specifications 147...
Страница 153: ...Appendix B Measurement Specifications 153...


