


LabQuest
®
3 User Manual
www.vernier.com/labq3
33
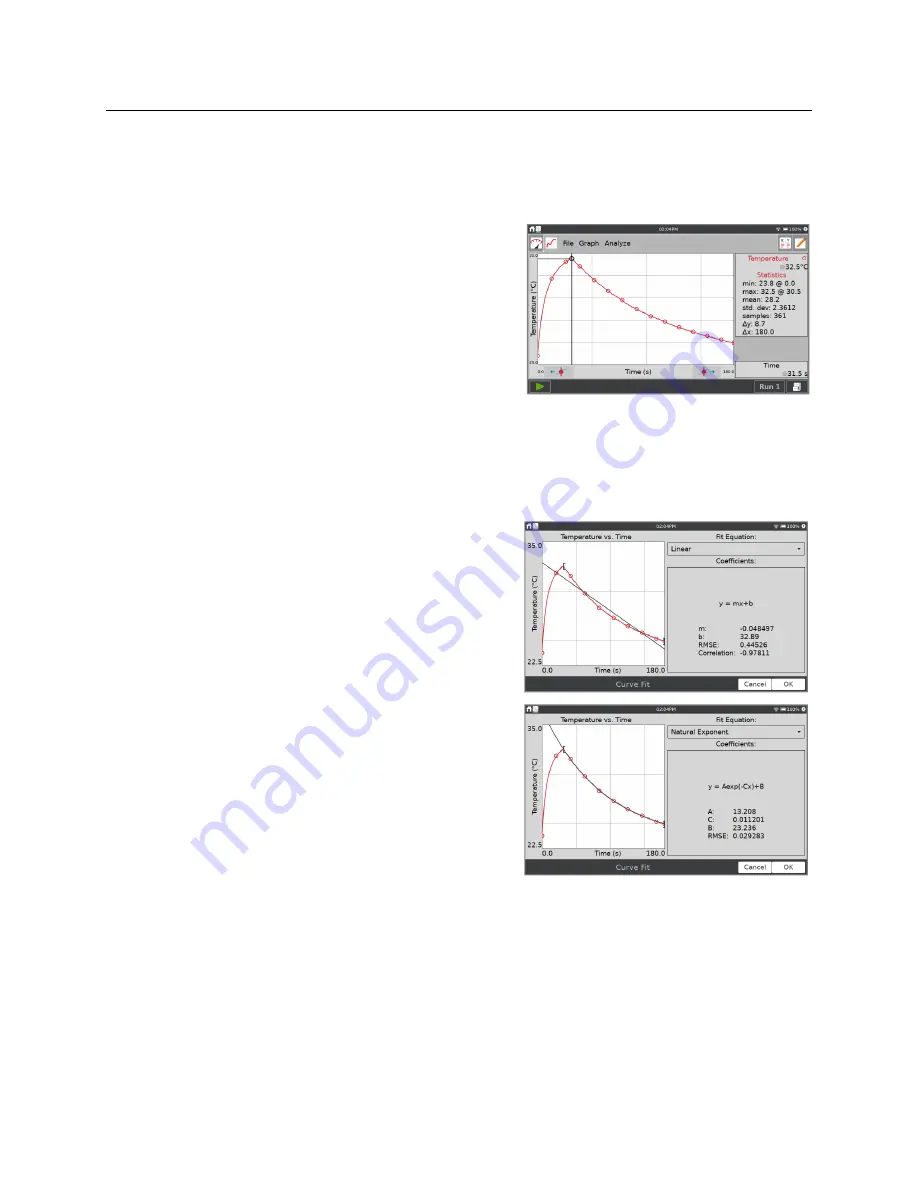
Statistics
The Statistics tool displays descriptive statistics for selected data. If a region of the graph is
selected, only that region is used for fitting. If there is no selection, the entire graph is used.
From the Graph screen, choose Statistics from the
Analyze menu. Enable the tool by tapping on the
displayed sensor or column name.
The results are displayed in a panel to the right of the
graph. If a region is selected, brackets are drawn to
indicate the region used for calculations.
Curve Fit
The Curve Fit tool fits a chosen function to your data. If a region of the graph is selected, only
that region is used for fitting. If there is no selection, the entire graph is used.
From the Graph screen, choose Curve Fit from the
Analyze menu. Enable the tool by tapping on the
displayed sensor or column name.
A linear fit is displayed by default. To select a
different curve fit, tap the fit equation and choose the
desired equation.
LabQuest displays the fit in the preview graph at the
left. The fit coefficients and root mean square error
(RMSE) are displayed. For linear fits, the correlation
coefficient is also displayed.
Tap OK to keep this fit and display the curve on the
Graph screen. To exit the Curve Fit tool without
applying the curve fit, tap Cancel.
TIP!
The RMSE is a measure of how well the fit matches the data. The smaller the RMSE, the
closer the data points are to the fitted line. The RMSE has the same units as the y-axis data.


