


Using the Touch Screen
6
Vernier Software & Technology
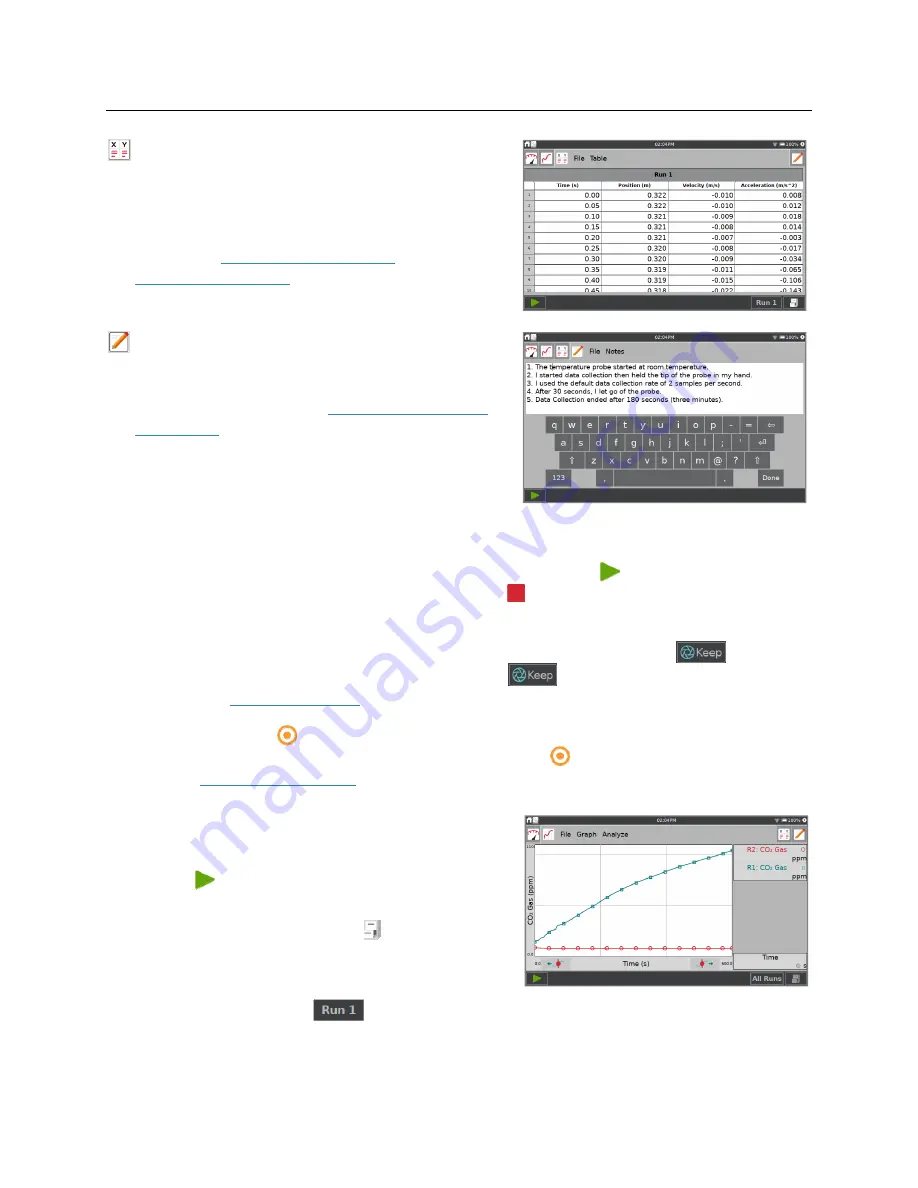
Table screen
—Use the Table screen to view a
tabular representation of your data, create
calculated columns, and manually enter data.
For a detailed description of how the Table screen
is used, see
Manually Entering Data
and
Analyzing Your Data
.
Notes screen
—From the Notes screen you can
record observations about your experiment.
For more information, see
Adding Notes to Your
Experiment
.
Data-Collection Controls
To start data collection from any LabQuest App screen, tap Collect, . As data are collected,
the graph and table are updated live. You can tap Stop, , to end data collection early or wait
until the collection completes.
In event-based data-collection modes (e.g., Events with Entry), a Keep button,
, appears to
the right of the Stop button. In this mode, you must tap
to record the data point. For more
information, see
Events with Entry
.
The Data Mark button, , appears to the right of the stop button when the data mark option is
enabled for time-based collections. As data are collected, tap to mark a particular point of
interest. See
Enable Data Marking
for more information.
Collecting Multiple Runs
To collect more data, overwriting your existing data,
tap Collect, , again.
To collect additional data without overwriting your
previous collection, tap Store Run, , before starting
a new data collection.
To display multiple runs of data on the same graph,
tap the run indicator button,
, and select All
Runs.


