


LabQuest
®
3 User Manual
www.vernier.com/labq3
27
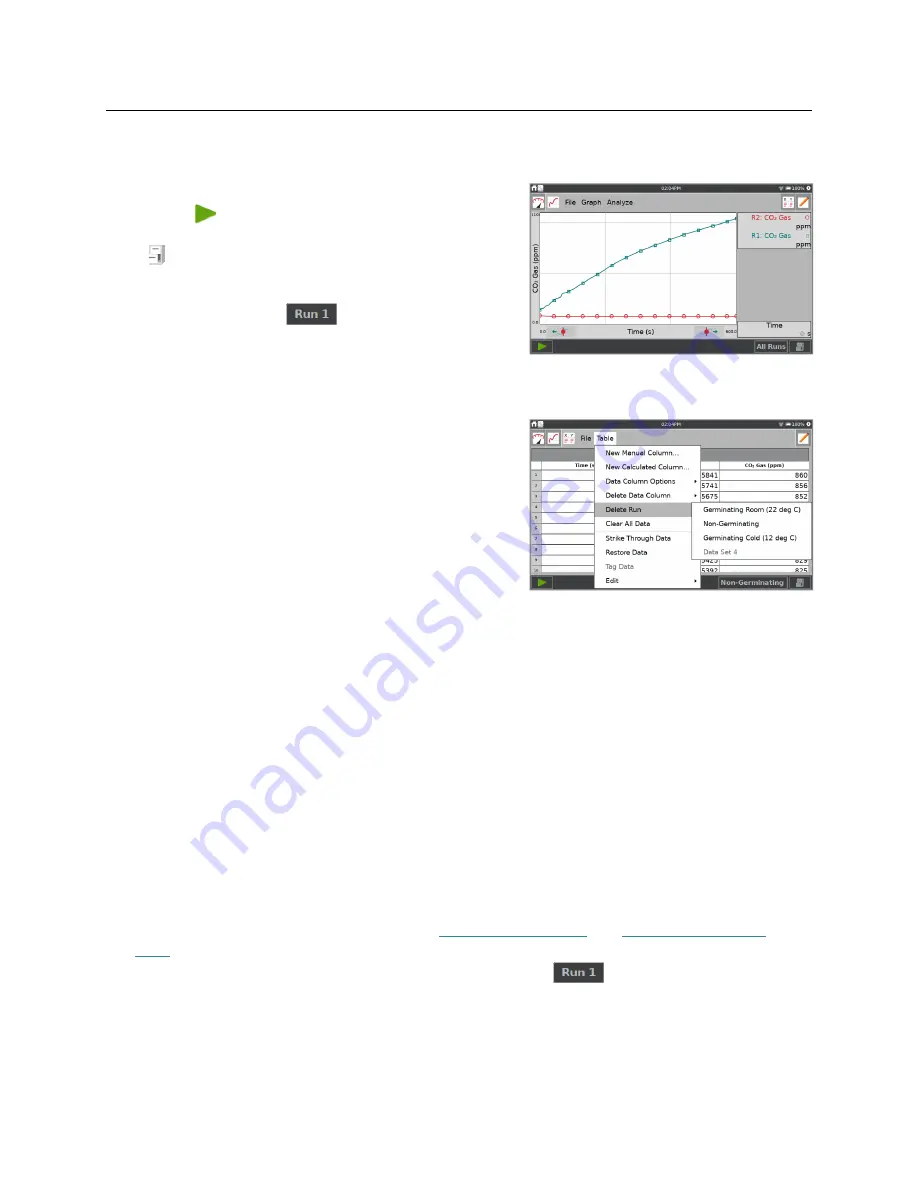
Collecting Multiple Runs
To collect more data, overwriting your existing data,
tap Collect,
, again. To collect additional data
without overwriting your previous collection, tap Store
Run, , before starting a new data collection.
To display multiple runs of data on the same graph, tap
the run indicator button,
, and select All Runs.
Deleting Unwanted Runs
If you have collected multiple runs, you can delete runs
that are no longer needed.
From the Table screen, choose Delete Run from the
Table menu and select a run to delete.
NOTE:
You cannot delete the last dataset created as it
is the active dataset for continued data collection.
Manually Entering Data
You can use LabQuest App to graph and analyze manually entered data. When no sensors are
connected, the table and graph default to display two manual data columns: X and Y. You can
manually enter data from the Table screen.
Navigating the Table Screen
Below are the common gestures used to navigate the Table screen:
Edit a cell
—Double-tap a cell, column name, or run name to edit the contents.
Scroll the data table
—Swipe up and down to scroll the data table.
Pan the data table
—When there are more than five columns in your data table, you can
touch and drag the table to view the additional columns.
Select multiple cells
—Touch-and-hold, then drag across the screen to select multiple cells.
Use the selected cells in conjunction with
Strike Through Data
and
Cut/Copy/Paste edit
tools
found in the Table menu.
Change the displayed run
—Tap the Run indicator button,
, to change which dataset is
displayed on the data table.


