CP390i and CPF390i
Page 65
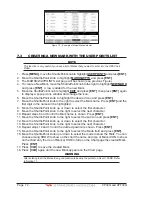
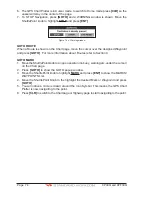
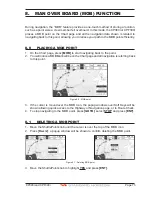
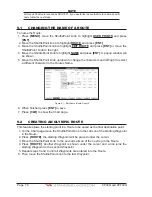
3. Move the ShuttlePoint knob to highlight
CURRENTS PREDICTION
and press
[ENT]
or
move the ShuttlePoint knob to the right.
4. A window is shown on the low-left side of the chart. Press
[S
ET
T
IME
]
to set the date
and time manually, and
[I
NCR
. T
IME
]
/
[D
ECR
. T
IME
]
to decrease/increase time; press
[E
XIT
]
to exit.
6.0.8 Chart Language
The CP390i and CPF390i may be customized to show the local language of the chart.
To select the Chart Language you want:
1. Press
[MENU]
, move the ShuttlePoint knob to highlight
SETUP MENU
and press
[ENT]
.
2. Move the ShuttlePoint knob to highlight
MAX FUNCTIONS
and press
[ENT]
or move
the ShuttlePoint knob to the right.
3. Move the ShuttlePoint knob to highlight
CHART LANGUAGE
and press
[ENT]
or move
the ShuttlePoint knob to the right. A new popup window will appear on the screen. The
available functions are described in the table below.
Language
: Allows setting the language to display chart information. The language is chosen among the list
of languages available on the cartographic data (data cartridge or embedded charts).
Mode
: Defines how objects are translated. Selections are:
Off
: Enables the language chosen in the Language menu above. If the selected
language is not present on the objects information, English is used.
English : Always uses English.
Local
: Uses the Local language present on C-MAP B
Y
J
EPPESEN
C-CARD. If no Local
language is available, English is used.
4. After the selection is made, press
[CLR]
repeatedly or move the ShuttlePoint knob to
the left repeatedly until the Chart page is shown.
NOTE
a. When the Chart Language is changed, the following settings are automatically selected: MODE
is set to Off and Chart Language is set to your selection.
b. If the C-CARD is removed or changed, the Chart Language should be confirmed and changed
if necessary.
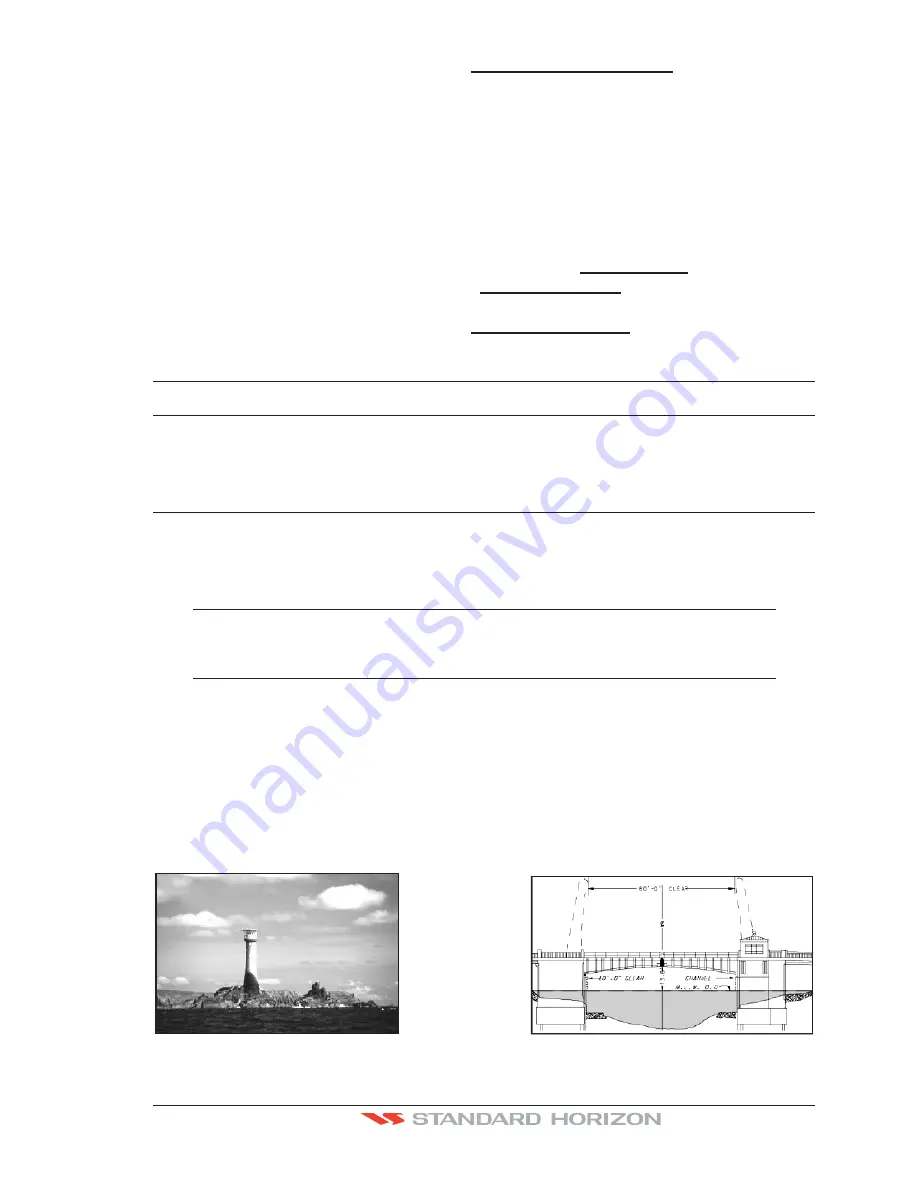
6.0.9 Pictures or Diagrams
Using optional C-MAP B
Y
J
EPPESEN
MAX data cards allows you to show pictures or diagrams
on the CP390i and CPF390i display. These
Pictures
are typically used to facilitate the
identification of cartographic objects or places around the chart: they can be the landscape
layout nearby a harbor, the shape of a bridge or of a buoy etc. On some objects, such as
bridges, the image associated can represent the
Diagram
representing the shape of the
objects and the various characteristics (length, height, type of bridge etc.).
Figure 6.0.9 - Pictures and Diagrams
Содержание CP390i
Страница 1: ......
Страница 5: ...Page 6 CP390i and CPF390i ...
Страница 15: ...Page 16 CP390i and CPF390i ...
Страница 29: ...Page 30 CP390i and CPF390i ...
Страница 43: ...Page 44 CP390i and CPF390i ...
Страница 53: ...Page 54 CP390i and CPF390i ...
Страница 67: ...Page 68 CP390i and CPF390i ...
Страница 75: ...Page 76 CP390i and CPF390i ...
Страница 83: ...Page 84 CP390i and CPF390i ...
Страница 87: ...Page 88 CP390i and CPF390i ...
Страница 109: ...Page 110 CP390i and CPF390i ...
Страница 145: ...Page 146 CP390i and CPF390i Figure 17 16 C Card Restore settings ...
Страница 147: ...Page 148 CP390i and CPF390i ...
Страница 153: ...Page 154 CP390i and CPF390i ...
Страница 157: ...Page 158 CP390i and CPF390i ...
Страница 168: ......


