


Chapter 6 — Monitoring a Verde Array
Monitor the Verde Arrays
September 2017
User Guide
—
Spectra Verde Array
116
6.
If
desired,
click
Download as CSV
in
the
lower,
left
corner
of
the
panel,
to
download
a
comma
separated
value
file,
containing
the
data
for
the
graph
you
are
currently
viewing.
The
file
can
then
be
imported
into
MicroSoft
Excel
or
other
software
applications
that
support
this
file
type.
7.
To
see
the
performance
data
in
greater
detail,
select
the
desired
section
you
want
to
magnify
in
either
the
main
or
range
indicator
graph.
Using
the
mouse,
click
and
drag
the
cursor
horizontally
over
the
section
of
the
graph
that
you
want
to
magnify.
The
highlighted
section
of
data
is
shown
on
the
main
graph.
The
range
indicator
graph
continues
to
display
the
original
range
of
data,
with
the
section
that
is
currently
being
shown
on
the
main
graph
highlighted.
8.
Click
Reset View
to
reset
the
main
graph
to
the
default
view.
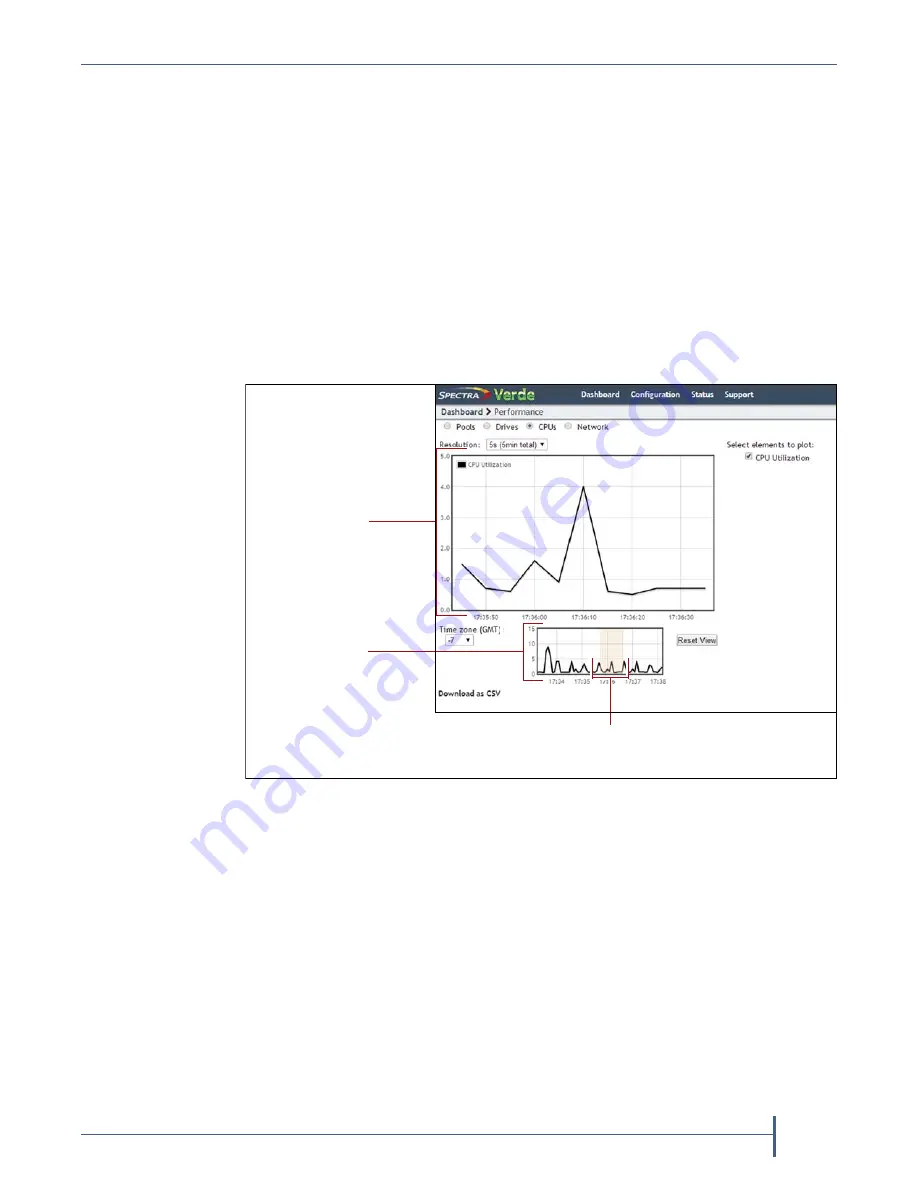
Figure 89
Highlight a section of the graph to show it in greater detail.
Main graph
Range indicator
Highlighted section
currently displayed on main graph
graph


